

Quantitative Trading Journal: Track the Numbers That Matter
A quantitative trading journal tracks win rate, expectancy, and R multiples. Learn which metrics to record and how to calculate them after 50 trades.

A quantitative trading journal tracks the raw numbers behind your trading. Win rate, average win, average loss, expectancy, R multiples. These are the metrics that tell you whether your strategy actually works or whether you are just getting lucky.
Most traders skip this step. They close a trade, feel something about it, and move on. No record. No math. No feedback. And then they wonder why they are stuck at the same level six months later.
The quantitative side of journaling gives you cold, honest data. It strips away the stories you tell yourself and replaces them with proof.
TL;DR
A quantitative trading journal records numerical data from every trade: P&L, position size, R multiples, and win rate.
Win rate alone is meaningless without knowing your average win size versus average loss size.
Expectancy tells you how much you earn per dollar risked, on average, across all trades.
You need at least 50 trades before the numbers start revealing reliable patterns.
Numbers show what happened, but not why. Pair quantitative data with qualitative notes for the full picture.
What a Quantitative Journal Tracks
A quantitative trading journal records every measurable detail from each trade. Entry price, exit price, stop loss level, take profit level, position size, the pair or instrument, the session, and the date.
From those raw inputs, you calculate the metrics that actually matter. P&L in dollars and in R (risk multiples). Whether the trade was a win or a loss. How long you held it. What your risk-to-reward ratio was going in versus what it was coming out.
Think of it like a business tracking revenue and expenses. Without the numbers, you are guessing. With them, you can see exactly where the money comes from and where it leaks out.
The key difference between a quantitative journal and just checking your broker statement is intention. Your broker shows P&L. A proper journal template records the context around that P&L so you can learn from it.
What Most Traders Actually Track (And What They Miss)
Most traders who bother journaling at all record their P&L and maybe the pair they traded. That is not enough.
Here is what gets missed: the R multiple of each trade, the planned risk versus actual risk, and the win/loss classification tied to plan adherence (not just dollars). If you took a 2R winner but your plan called for a 3R target, your quantitative journal should capture both numbers. The gap between planned and actual is where improvement lives.
The Core Metrics to Record
Five metrics form the foundation of every quantitative trading journal. Get these right and you have a working feedback loop. Skip any of them and you are flying half-blind.
Win Rate. The percentage of trades that end in profit. Simple to calculate: winning trades divided by total trades. A 40% win rate sounds bad until you pair it with large R multiples. A 70% win rate sounds great until you realize each winner is tiny and each loser is massive.
Win rate means nothing in isolation. Always read it alongside your average win and average loss.
Average Win. The mean profit across all winning trades, measured in R. If your winners average 2.5R, each winning trade returns 2.5 times what you risked.
Average Loss. The mean loss across all losing trades, measured in R. Ideally this stays close to 1R. If your average loss is 1.5R or higher, you are letting losers run past your stop, and that is a discipline problem, not a strategy problem.
R Multiple. Every trade outcome expressed as a multiple of your initial risk. Risked $200, made $600? That is a 3R trade. Risked $200, lost $180? That is a 0.9R loss. R multiples normalize your results so you can compare trades of different sizes.
Expectancy. The average amount you earn per unit of risk across all trades. The formula:
Expectancy = (Win Rate x Average Win) - (Loss Rate x Average Loss)
This is the single number that tells you whether your strategy produces money over time.
How to Calculate Your Numbers After 50 Trades
Fifty trades is the minimum sample where patterns start to emerge. Below that, randomness dominates. One hot streak or one cold streak distorts everything.
Here is how to run the math after your first 50 trades.
Walkthrough: Calculating Expectancy From 50 Trades
Suppose you completed 50 trades. 20 were winners. 30 were losers.
Your win rate: 20 divided by 50 = 40%.
Your loss rate: 30 divided by 50 = 60%.
Now look at the R multiples. Your 20 winners averaged 2.5R each. Your 30 losers averaged 1R each.
Expectancy = (0.40 x 2.5R) - (0.60 x 1R)
Step by step:
0.40 x 2.5R = 1.0R
0.60 x 1.0R = 0.6R
1.0R - 0.6R = 0.4R
Your expectancy is 0.4R. That means for every dollar you risk, you earn 40 cents on average over time. Positive expectancy. Your strategy works mathematically.
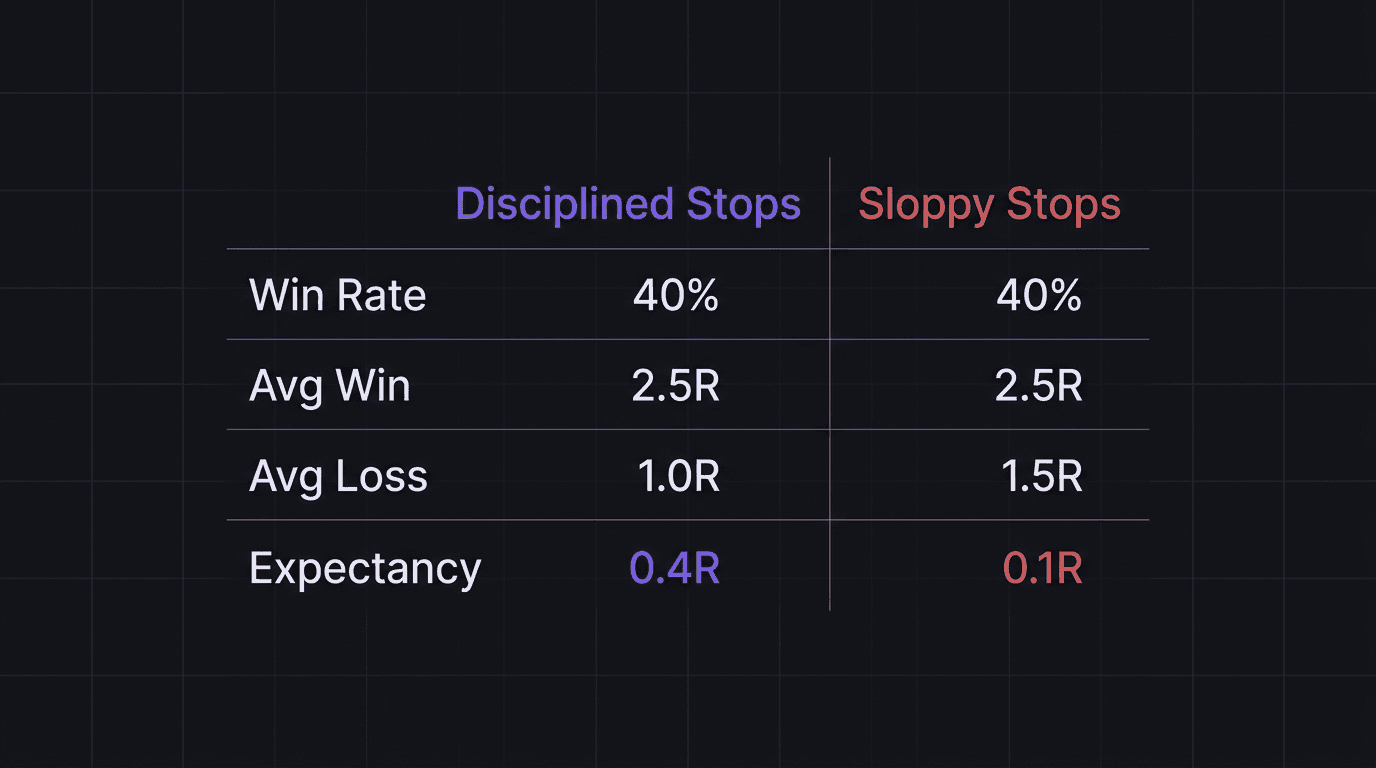
Now here is the critical part. If your average loss was 1.5R instead of 1R (meaning you are regularly letting trades run past your stop), the math changes dramatically:
0.40 x 2.5R = 1.0R
0.60 x 1.5R = 0.9R
1.0R - 0.9R = 0.1R
Your edge shrinks from 0.4R to 0.1R. Same win rate. Same average win. But sloppy stop management nearly wipes out your profitability. The numbers expose this instantly. Without them, you would never know.
What to Do After You Run the Numbers
Once you have your core metrics from 50 trades, ask three questions:
Is my expectancy positive? If yes, the strategy has a mathematical edge. Keep executing.
Is my average loss staying at or below 1R? If not, the problem is execution, not strategy. Your post-trade review should focus on why stops are getting moved.
Does my equity curve match what my expectancy predicts? If expectancy says 0.4R but your curve is flat or declining, something is inconsistent in your execution.
Why Numbers Alone Are Not Enough
Here is the uncomfortable truth about a quantitative trading journal: it tells you what happened, but not why.
You can see that your win rate dropped from 45% to 35% last month. But the numbers alone will not tell you whether that happened because you traded during news events, because you were tired from poor sleep, or because you started chasing setups outside your plan.
Numbers are the foundation. They are the starting line, not the finish line. A trader who only tracks quantitative data will spot the symptom (declining expectancy) but miss the cause (revenge trading on Fridays after a Thursday loss).
This is exactly why quantitative journaling needs a partner. Qualitative journaling captures the human layer: your mental state, your decision rationale, the emotions that influenced your entries and exits. Together, the two types give you a complete diagnostic.
Ever noticed that your worst trading weeks all have something in common? Maybe it is always the same session. Maybe it is always after a winning streak when you feel invincible. The numbers flag the pattern. But only your written notes explain it.
The Mistake: Treating the Journal as a Scoreboard
The biggest trap with quantitative journaling is treating it like a scoreboard. You check your win rate, feel good or bad about it, and close the spreadsheet. That is not journaling. That is keeping score.
Real quantitative journaling means asking questions of the data. Which setups produce the highest R multiples? Which sessions have the lowest win rate? Is there a difference in your average loss on days when you take three or more trades versus days when you take only one?
The data is only useful when you interrogate it. Otherwise it just sits in a spreadsheet making you feel productive.
How EdgeFlo Tracks Your Quantitative Data Automatically
EdgeFlo's AI-powered trading journal auto-imports your trades and calculates win rate, average R, expectancy, and other core metrics without manual data entry. You can override it if needed, but the numbers populate in real time as trades close.
The trading dashboard surfaces these quantitative metrics alongside your discipline summary and EdgeScore, so you see the full picture without switching between tools. Weekly AI reports (Plus plan) highlight trends and anomalies in your data that you might miss reviewing on your own.
If you have been tracking trades in a spreadsheet and want to move to a system that calculates everything automatically, EdgeFlo centralizes your quantitative journal, your qualitative notes, and your performance analytics in one place.
What is a quantitative trading journal?
How many trades do I need before journal data is useful?
What is the most important metric to track in a trading journal?
Can I use a spreadsheet as a quantitative trading journal?

Turn discipline on.
Every session.
EdgeFlo is the environment serious traders operate inside.
Start 7-Day Trial — $7
Cancel anytime.
No long-term commitment.


Think Different, Trade Different.