

Personal Benchmarks: Track Your Highs and Lows
Generic benchmarks do not fit your account or style. Learn how to extract personal trading benchmarks from your journal data and measure real progress.

"What's a good win rate?" is one of the most common questions beginner traders ask. The honest answer is: it depends entirely on you. A 40% win rate is excellent for one strategy and terrible for another. A $500 weekly profit target makes sense for a $50,000 account and is delusional for a $2,000 account.
Generic benchmarks are worse than useless; they are misleading. The only numbers that matter are your personal benchmarks, extracted from your own trading journal, reflecting your own strategy, account size, and emotional patterns.
TL;DR
Generic trading benchmarks (industry win rates, average returns) mislead because they ignore your specific context.
Personal benchmarks come from your own trade journal analysis.
Five key benchmarks reveal your actual ceiling, floor, and operating range.
Benchmarks help you spot the self-destruction cycle early, before a drawdown becomes a blow-up.
Update your benchmarks monthly so they reflect your current skill, not outdated data.
Why Generic Benchmarks Mislead Traders
Someone on a forum says "a 50% win rate is good." Another trader says "you need at least 2:1 risk-to-reward." A YouTube video claims "professional traders make 5 to 10% per month."
None of these numbers mean anything without context. A scalper taking 30 trades per day with a 70% win rate and 0.5:1 R:R operates in a completely different world from a swing trader taking 4 trades per week with a 35% win rate and 4:1 R:R. Both can be profitable. Both would fail if they tried to hit the other's benchmarks.
The problem with generic benchmarks is that they create either false confidence or unnecessary despair. If your win rate is 38% and you think "good" is 50%, you might abandon a perfectly profitable strategy. If your monthly return is +3% and you think "normal" is +10%, you might take excessive risk to chase a number that was never realistic for your approach.
Your trading journal contains the real numbers. They are specific to your strategy, your pairs, your timeframes, your psychology. Those are the only benchmarks worth tracking.
Five Personal Benchmarks Every Trader Should Track
Here are the five numbers that define your operating range. Each one comes from your own data.
1. Peak weekly return (your ceiling indicator). What is the best single week you have had in the last 3 months, measured as a percentage of your account? This tells you what is currently possible when everything goes right.
2. Worst weekly drawdown (your floor indicator). What is the most you have lost in a single week? This defines how bad things get before you recover. Track this as a percentage, not dollars, so it scales with your account.
3. Average daily trade count. How many trades do you take on a typical day? This is not about what you plan to take; it is about what you actually take. If your plan says 3 and your journal says 5.2, you have a drift problem.
4. Monthly win rate range. Not a single win rate number, but the range. Your best month might be 55% and your worst might be 32%. That range tells you more than either number alone.
5. Largest single-day loss. This is the event risk benchmark. It shows you how much damage is possible when the wrecker takes the wheel for a full session. If your largest single-day loss is 4% and your monthly floor is -8%, you know that two bad days in a month define your entire floor.
Walkthrough: Building a Personal Benchmark Sheet
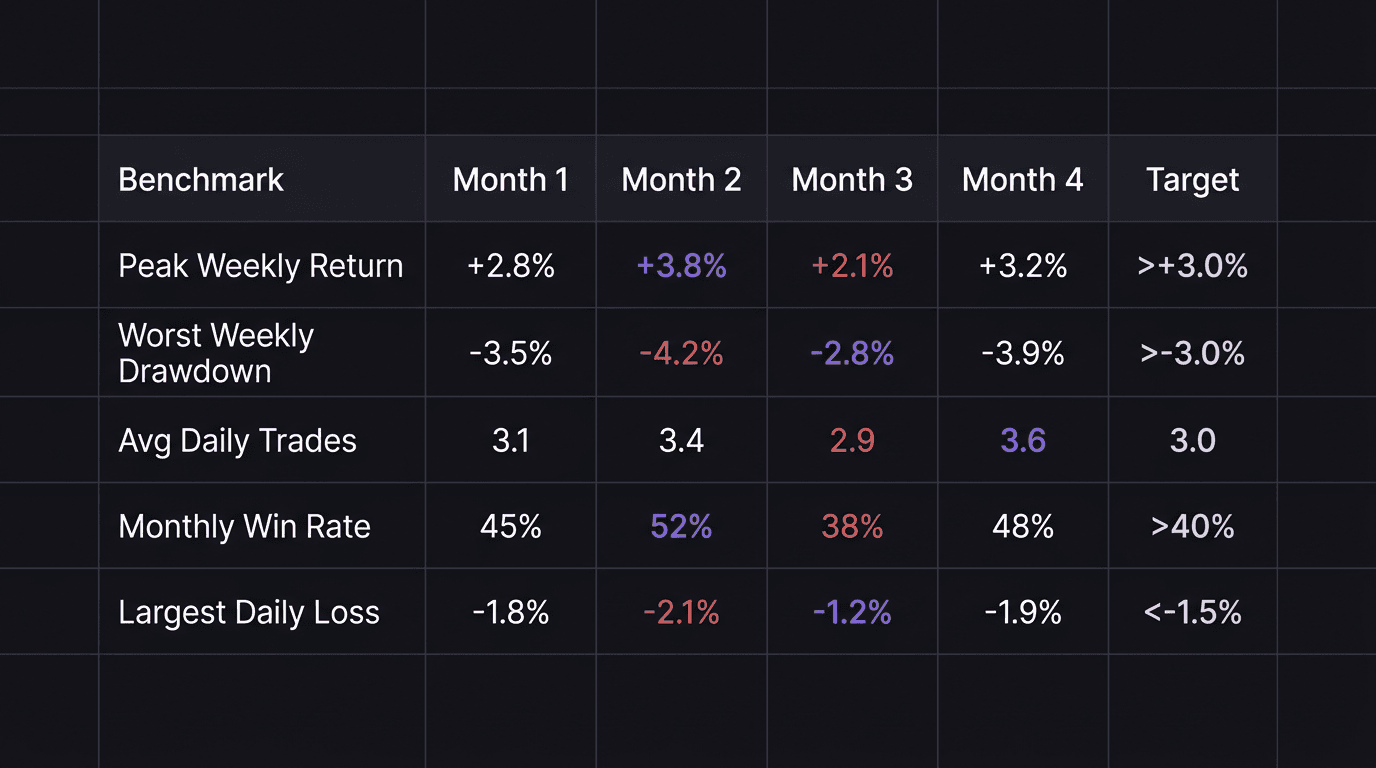
A trader with a $12,000 account reviews 4 months of EUR/USD journal data.
Peak weekly return: +3.8% ($456 in his best week). Worst weekly drawdown: -4.2% ($504 in his worst week). Average daily trade count: 3.4 (plan says 3, so slight drift). Monthly win rate range: 38% (worst) to 52% (best). Largest single-day loss: -2.1% ($252).
These are his benchmarks. Not someone else's. Not a generic recommendation from a trading book. His actual numbers, from his actual trading.
Now he can set meaningful targets: keep worst weekly drawdown above -3% (raise the floor), maintain trade count at 3.0 or below (fix the drift), keep largest single-day loss below -1.5% (tighten the guardrails).
How to Pull These Numbers from Your Journal
If you are using a spreadsheet or a trading journal, the process is straightforward:
Step 1: Export or review your trade log. You need entry date, pair, direction, entry price, exit price, lot size, P&L in dollars, and any emotion tags.
Step 2: Group by week. Sum the P&L for each Monday-through-Friday block. Calculate weekly return as a percentage of your starting balance for that week.
Step 3: Group by day. Sum daily P&L and count daily trades. This gives you average trade count and your single-day loss benchmark.
Step 4: Group by month. Calculate monthly win rate (winning trades divided by total trades) and monthly return.
Step 5: Identify the extremes. Highlight your best and worst week, your best and worst month, and your largest single-day loss. Those are your benchmarks.
If you do not have clean journal data, start now. Even one month of honest logging gives you enough to establish a baseline. Without the data, you are navigating blind.
Using Your Benchmarks to Spot the Destruction Cycle Early
Personal benchmarks are not just retrospective. They are an early warning system for the self-destruction cycle.
Here is how. The self-destruction cycle follows a predictable path: peak (ceiling hit), complacency, behavioral drift, drawdown, floor hit, recovery, repeat. Your benchmarks let you detect each transition before it turns into a crisis.
Signal 1: Trade count exceeds your average. If your benchmark average is 3.1 trades per day and this week you are averaging 4.5, you are taking off-plan trades. The wrecker is active.
Signal 2: Win rate drops below your floor range. If your worst monthly win rate was 38% and this month is tracking at 30%, something has changed. Either the market shifted or your execution drifted.
Signal 3: A single day threatens your worst-day benchmark. If your largest single-day loss was -2.1% and today you are already at -1.8% by noon, you need to stop. Right now. The floor is getting tested.
Walkthrough: Benchmarks Catch the Wrecker
A trader's benchmarks show average daily trade count of 3.2. On Wednesday, she notices she has already placed 5 trades by 11 AM. She checks the log: two of the five were outside her setup criteria.
Without the benchmark, she would not have noticed. With it, the drift is obvious. She stops trading for the day, reviews what triggered the extra trades (she was feeling confident after Monday's +2% day), and resets for Thursday.
Cost of catching it: zero (she stopped before more damage). Cost of not catching it: potentially her worst-day benchmark gets a new, uglier number.
The beauty of personal benchmarks is their specificity. "I am overtrading" is vague. "My trade count is 40% above my 3-month average" is actionable.
Your consistency metrics and your equity curve tell the same story from different angles. Benchmarks give you the specific thresholds where the story turns from "on track" to "in trouble."
How EdgeFlo Calculates Your Personal Benchmarks
EdgeFlo's trading dashboard and AI-powered journal with auto-import track every trade automatically, including your entry, exit, lot size, P&L, and the emotion tags you assign. The dashboard calculates your win rate, profit factor, and edge score across customizable time windows.
That means your personal benchmarks are not something you build in a spreadsheet and forget to update. They are live numbers that update with every trade. When your average daily trade count drifts, the data shows it. When your weekly drawdown exceeds your recent range, you can see it in the dashboard.
The journal captures the qualitative side (emotion tags, notes, session context) while the dashboard captures the quantitative side. Together, they give you a complete picture of your operating range, updated in real time, so the destruction cycle never sneaks up on you.
What are personal trading benchmarks?
How many months of data do I need for personal benchmarks?
What benchmarks should every trader track?
How often should I update my personal benchmarks?

Turn discipline on.
Every session.
EdgeFlo is the environment serious traders operate inside.
Start 7-Day Trial — $7
Cancel anytime.
No long-term commitment.


Think Different, Trade Different.