

Performance Discrepancy: The Gap Between Your Plan and Your Execution
Performance discrepancy measures the gap between how your strategy should perform and how you actually execute it. Learn to measure, diagnose, and close the gap.

Performance discrepancy is the gap between how your trading strategy should perform and how you actually perform using it. Your backtest says the strategy produces 0.4R expectancy. Your live results show 0.1R. That 0.3R gap is your performance discrepancy, and it is the single most important number most traders never measure.
Every trader has a strategy. The ones who make money are the ones who execute it consistently enough to close the gap between the plan and reality.
TL;DR
Performance discrepancy measures the gap between your strategy's potential results and your actual execution results.
The wider the gap, the more human error is costing you. A narrow gap means strong execution quality.
Measure it by comparing plan-only trade results against your total results over 50 or more trades.
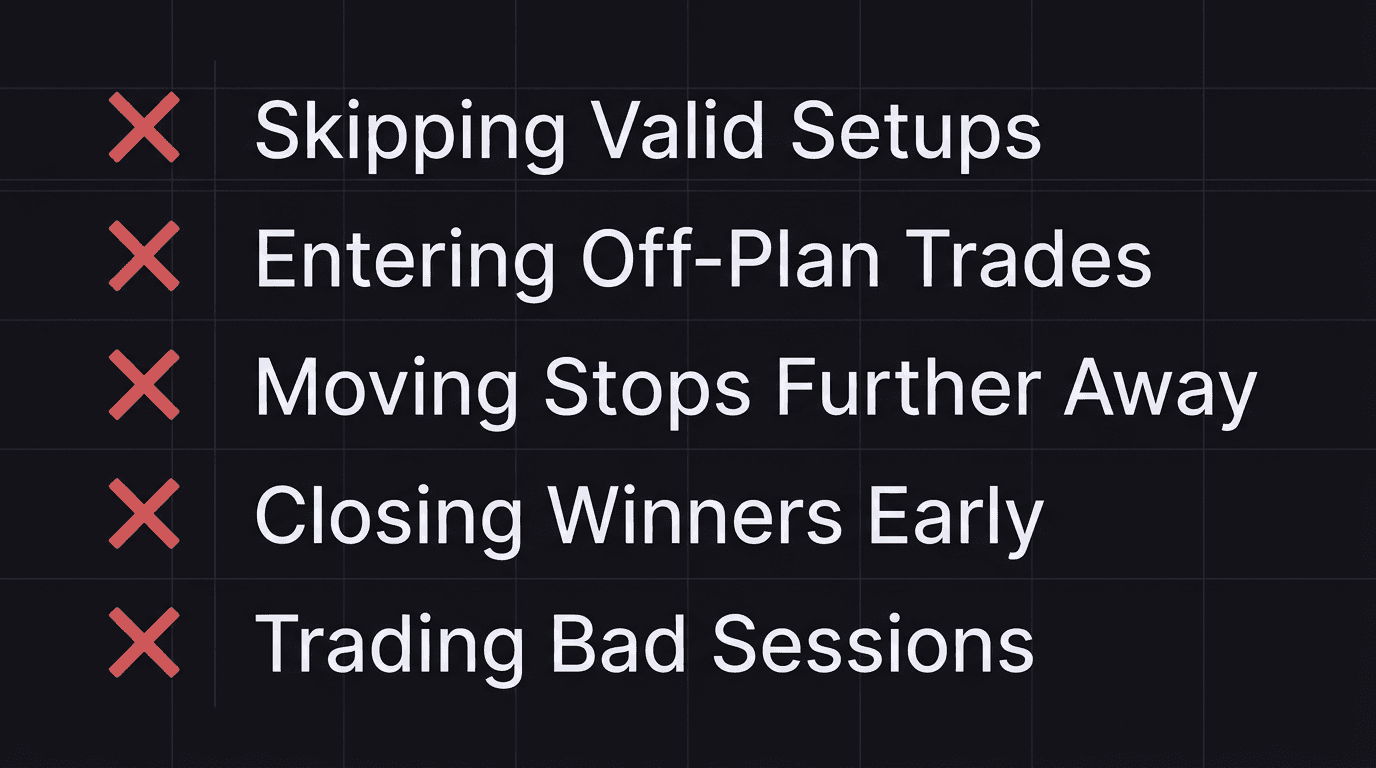
Common discrepancy sources: skipping setups, entering off-plan, moving stops, closing early, and trading bad sessions.
Reducing this gap is more valuable than finding a new strategy. The edge is already there. You just need to stop interfering with it.
What Performance Discrepancy Means
Your trading strategy has a theoretical performance level. This is what it produces when every trade is taken exactly as planned, with correct entries, correct stops, and correct management. You can approximate this number from your backtest data or from your plan-only trade results.
Your actual performance is what shows up in your account. It includes every trade: the on-plan ones, the off-plan ones, the ones where you moved your stop, the ones where you closed early, and the ones where you skipped a valid setup entirely.
The difference between those two numbers is your performance discrepancy.
If your strategy produces 0.5R expectancy on paper and your live results show 0.3R, the discrepancy is 0.2R per trade. On 100 trades risking $200 each, that 0.2R gap costs you $4,000.
That is not a strategy problem. That is an execution problem. And it is fixable without changing a single parameter of your trading plan.
Think of it like a car. The engine (your strategy) can go 120 mph. But if you keep braking randomly, swerving into wrong lanes, and forgetting to shift gears, you might average 60 mph. The car is not slow. The driver is interfering.
Measuring the Gap Between Plan and Execution
To measure performance discrepancy, you need two data sets.
Data Set 1: Plan-Only Results. Filter your trading journal to show only trades that were 100% on-plan. Trades where you followed every criterion, entered at the right level, and managed the trade according to your rules. Calculate win rate, average win, average loss, and expectancy for these trades only.
Data Set 2: Total Results. All trades. On-plan, off-plan, everything. Same metrics: win rate, average win, average loss, expectancy.
The gap between those two sets of numbers is your performance discrepancy.
Walkthrough: Measuring the Gap Over 60 Trades
A trader completes 60 trades in a quarter. 42 were on-plan. 18 were off-plan.
Win rate: 45% (19 wins, 23 losses)
Average win: 2.3R
Average loss: 1.0R
Expectancy: (0.45 x 2.3) - (0.55 x 1.0) = 1.035 - 0.55 = 0.485R
Win rate: 38% (23 wins, 37 losses)
Average win: 1.9R
Average loss: 1.2R
Expectancy: (0.38 x 1.9) - (0.62 x 1.2) = 0.722 - 0.744 = -0.022R
Look at that. The plan-only trades have a healthy 0.485R expectancy. The strategy works. But when you include the 18 off-plan trades, total expectancy drops to -0.022R. Barely breakeven.
The performance discrepancy is 0.485R minus (-0.022R) = 0.507R per trade.
This trader does not need a new strategy. They need to stop taking off-plan trades and stop letting their average loss creep above 1R. The edge is already there. Execution is burying it.
If this trader risked $150 per trade, the 0.507R discrepancy across 60 trades cost:
0.507 x $150 x 60 = $4,563
That is real money lost to execution errors, not market conditions.
Common Discrepancy Patterns
After measuring your discrepancy, the next question is: where exactly is the gap coming from? There are five common patterns, and most traders struggle with at least two.
Pattern 1: Skipping Valid Setups
Your plan produces a setup. It meets every criterion. But you do not take it. Maybe you are still stinging from yesterday's loss. Maybe the entry looks "too obvious." Maybe you just were not at your screen.
Skipped setups lower your actual win count without lowering your loss count. Your strategy produced the opportunity. You just were not there to capture it.
Pattern 2: Entering Off-Plan Trades
The opposite problem. You enter trades that do not meet your criteria. These trades have a lower win rate and higher average loss than your on-plan trades, which drags down your overall numbers.
This is the most measurable discrepancy source because you can directly compare off-plan trade stats against on-plan trade stats in your journal.
Pattern 3: Moving Stops
Your stop loss is placed at the correct technical level. Price moves against you. Instead of accepting the planned 1R loss, you move your stop further away, turning a 1R loss into a 1.5R or 2R loss.
This inflates your average loss, which directly reduces expectancy. Even a small increase in average loss (from 1R to 1.2R) can cut your edge significantly.
Pattern 4: Closing Winners Early
Price is heading toward your target. You are up 1.5R. You feel the urge to take profit "before it reverses." You close at 1.5R instead of letting it hit your 3R target.
This shrinks your average win, which is the other half of the expectancy equation. Cutting winners is just as damaging as letting losers run.
Pattern 5: Trading Bad Sessions
Your performance review data shows that your win rate drops significantly during certain conditions: late afternoon trades, Friday sessions, or the 30 minutes around major news releases. If you keep trading during those periods, you are voluntarily adding low-quality data to your results.
Using Discrepancy Data to Improve
Once you know where your gap comes from, you can fix it without changing your strategy at all. This is the power of measuring performance discrepancy. The improvement is in execution, not in finding a better system.
Step 1: Quantify Each Source
For each of the five patterns above, calculate how much it costs you. If moving stops added 0.2R to your average loss across 15 trades at $200 risk, that cost you $600. If skipping setups meant you missed 8 valid trades that averaged 2.3R, you left $3,680 on the table.
Step 2: Fix the Biggest Leak First
Do not try to fix everything at once. Pick the single discrepancy source that costs you the most and focus on it for the next 30 trades. If it is "closing winners early," your one focus is letting trades run to target for the next month.
Step 3: Remeasure After 50 Trades
After 50 trades with the fix in place, run the discrepancy calculation again. Did the gap shrink? By how much? The number tells you whether the fix worked.
Trading consistency is not about perfection. It is about steadily closing the gap between what your plan can do and what you actually do. Measuring the discrepancy gives you a concrete target instead of the vague goal of "trading better."
Step 4: Repeat
Once the biggest leak is closed, move to the second biggest. Over two or three quarters, this process can turn a breakeven trader into a profitable one without ever changing the strategy.
How EdgeFlo Surfaces Your Discrepancy
EdgeFlo's trading dashboard tracks plan adherence alongside win rate and expectancy. When you mark each trade as on-plan or off-plan in the post-trade review, the system calculates separate metrics for each group automatically.
The weekly AI report (Plus plan) compares your plan-only stats against your total stats and highlights the gap. If your on-plan expectancy is 0.5R but your total expectancy is 0.1R, the report flags that discrepancy and links it to the specific off-plan trades that caused it.
You do not need a separate spreadsheet to measure your performance discrepancy. EdgeFlo does the split for you, so you spend your time fixing the problem instead of finding it.
What is performance discrepancy in trading?
How do I measure my performance discrepancy?
What causes performance discrepancy?
How small should my performance discrepancy be?

Turn discipline on.
Every session.
EdgeFlo is the environment serious traders operate inside.
Start 7-Day Trial — $7
Cancel anytime.
No long-term commitment.


Think Different, Trade Different.