

Order Flow Trading: Read What the Chart Actually Shows
Order flow trading reveals real buyer and seller pressure through price structure. Learn to map swings, read pullbacks, and enter based on what price does.

Order flow trading means reading the actual pressure behind price movement. It tells you whether buyers or sellers are in control right now, not five candles ago, not on some lagging indicator. Right now.
Most traders hear "order flow" and think they need expensive software, footprint charts, or level-2 data. They do not. Every price chart already shows you order flow through structure: swing highs, swing lows, breaks of structure, and the internal legs between them.
This article breaks down how to map order flow from a blank chart using nothing more than price action. You will learn to identify swing ranges, track internal structure during pullbacks, spot market shifts, and find the highest-probability entries where all timeframes align.
TL;DR
Order flow trading reads buyer and seller pressure through price structure, not special tools.
Every pullback contains internal order flow (higher highs and higher lows) that moves opposite to the swing trend.
A market shift occurs when price breaks past the last internal higher low (or lower high), confirming the pullback is over.
The best entries happen when internal order flow aligns with swing order flow in the same direction.
Trading against the current order flow is the single biggest reason traders draw correct zones but still lose.
What Order Flow Actually Means on a Chart
Forget the footprint chart definition for a moment. On a price chart, order flow is simply the sequence of highs and lows that tells you which side has control.
When price creates higher highs and higher lows, buyers are running the show. When price creates lower highs and lower lows, sellers are dominant. That sequence of structural points IS the order flow.
The critical insight: order flow exists on multiple levels at the same time. You have swing-level structure that defines the dominant trend, and you have internal structure that defines what is happening inside each swing leg.
A bearish swing trend, for example, creates lower highs and lower lows on the higher timeframe. But inside each pullback, the internal order flow is bullish. Price must create temporary higher highs and higher lows to pull back up to a supply range before sellers can push it down again.
That dual layer is where most confusion lives. And it is also where the best trade setups hide.
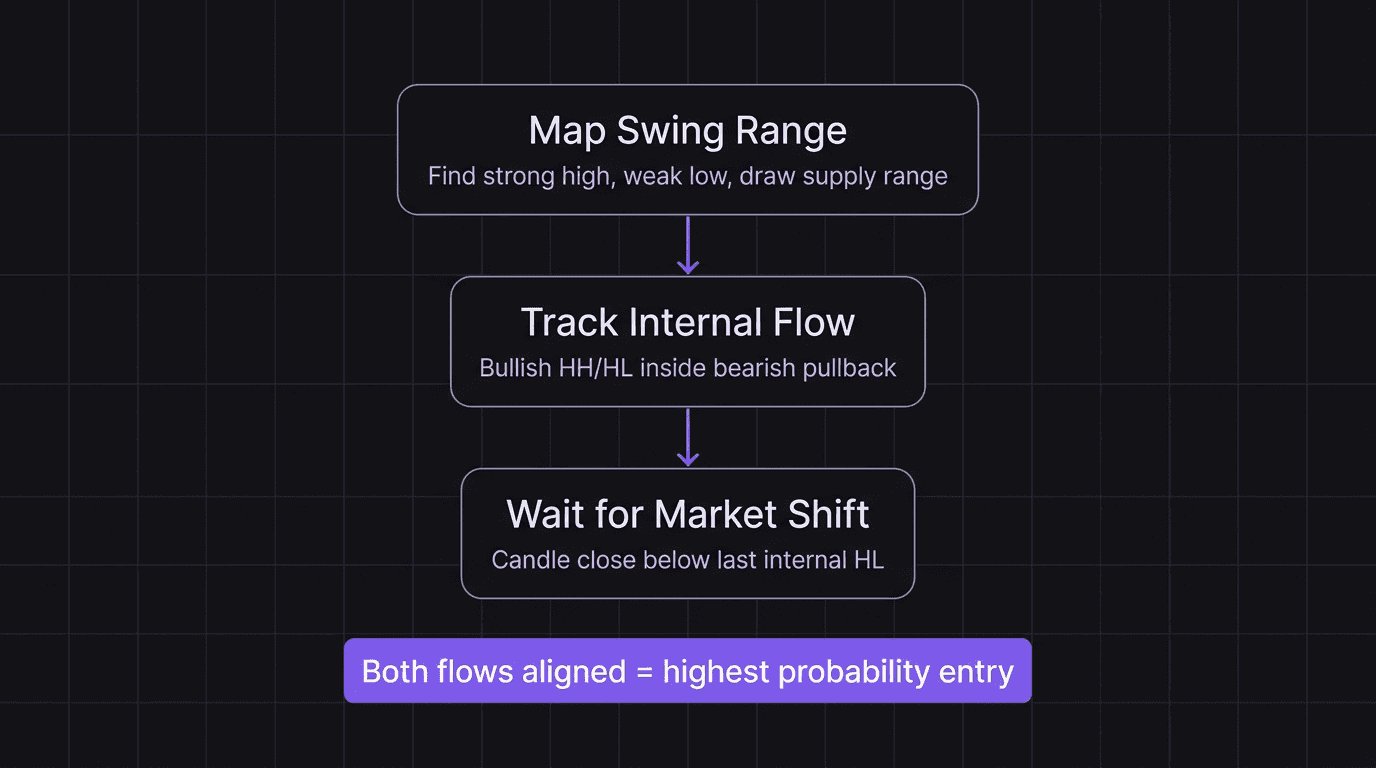
Step 1: Map the Swing Range
Start with a blank chart. Before anything else, find the most recent swing high and swing low.
Look for the point where price pushed down, pulled back, then broke past the previous low. That break creates a break of structure to the downside.
Once you have that bearish BOS:
Mark the strong swing high (the high that led to the break).
Mark the broken weak low.
Draw the supply range from the swing high down to the swing low, extended across to where price actually broke structure.
This supply range is where you expect price to pull back to. Sellers left unfilled orders in that zone, and price will likely return to mitigate those orders before continuing lower.
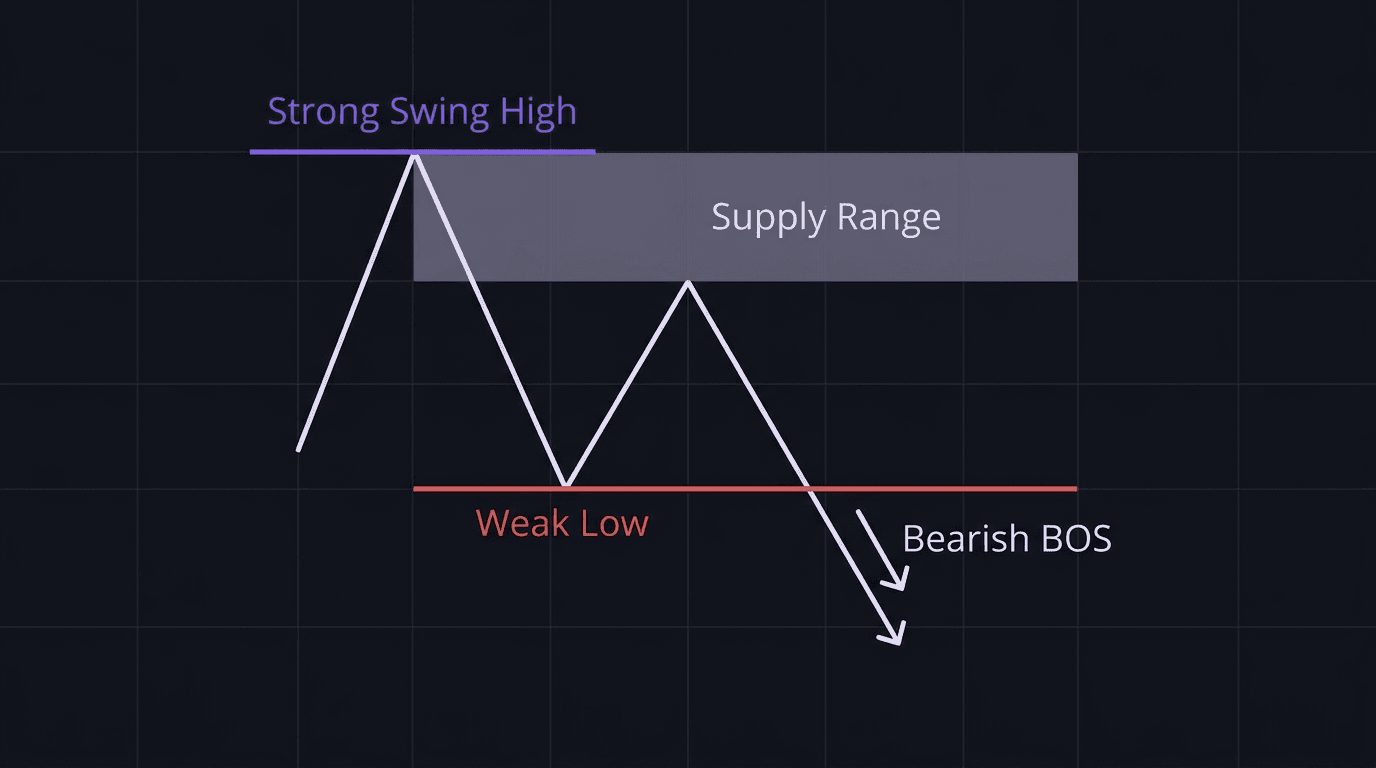
Step 2: Track Internal Order Flow During the Pullback
After a bearish BOS, price starts pulling back. This is where traders get confused, because the pullback looks bullish.
It is bullish. Internally.
The internal order flow turns bullish to facilitate the swing pullback. Price creates higher highs and higher lows as it travels up toward the supply range. Each internal break of structure to the upside confirms the pullback is still active.
Here is the mental framework:
Swing order flow: Bearish (lower highs, lower lows on the big picture).
Internal order flow: Bullish (higher highs, higher lows inside the pullback).
Objective of the pullback: Reach the supply range, mitigate sell orders, then reverse.
If you want to trade counter-trend during this phase, the best time is at the very start of the pullback, right after the market shift that begins the bullish internal flow. You look for a long position from a demand zone after the shift, but you manage expectations tightly. The swing trend is still bearish. You are trading a pullback, not a reversal.
The further price climbs into the supply range, the riskier long trades become. Every new higher high gets closer to the zone where sellers are waiting.
Step 3: Wait for the Market Shift
This is the step that separates profitable order flow traders from everyone else.
When price enters the supply range, most traders immediately short. That is a mistake. The internal order flow is still bullish. Until the internal structure shifts, buying pressure can push price higher, even past the supply range, even past the last swing lower high.
You wait for one specific event: price breaks past the last internal higher low with a candle close below it.
That is your market shift. It confirms that internal order flow has flipped from bullish to bearish.
Walkthrough: Bearish Market Shift on EUR/USD 4H
Picture EUR/USD on a 4-hour chart. The swing trend is bearish. Price pushed down and broke structure at 1.0850, establishing a strong swing high at 1.0960 and a new swing low.
Price starts pulling back. The internal order flow turns bullish: higher lows at 1.0870, 1.0890, and 1.0910. Higher highs form at 1.0900, 1.0920, and 1.0940.
Price enters the supply range between 1.0930 and 1.0960. A trader watching this wants to short, but the internal structure has not shifted yet.
Then it happens. Price drops from 1.0945 and closes below the last internal higher low at 1.0910. That candle close below 1.0910 is the market shift.
Now both swing order flow (bearish) and internal order flow (bearish) are aligned. You draw the new supply range from the high that caused the break. You wait for price to pull back into that supply range. And when it does, you have your highest-probability short entry.
The math on this entry: if your stop is 30 pips above the supply range high (at 1.0975) and your target is the previous weak low (let us say 80 pips below entry at 1.0850), you are looking at roughly a 2.6:1 reward-to-risk ratio on 0.5 lots. That is 0.5 lots times $10 per pip times 80 pips = $400 target, with a $150 risk (0.5 lots times $10 per pip times 30 pips).
Math check: $400 / $150 = 2.67R. Clean.
Why Trading Against Order Flow Costs You Money
This is the single biggest mistake intermediate traders make. They draw their supply and demand zones correctly. They understand structure. But they enter trades against the current order flow, and they lose.
Here is what it looks like in practice.
The internal order flow is bearish. Price is creating lower highs and lower lows. A trader sees price tap into a demand zone on the left side of the chart and thinks, "Demand zone. I should buy."
But that demand zone is being used as liquidity, not as support. Price taps it to facilitate a pullback before continuing the bearish internal flow. The trader gets a brief bounce, sets a wide target, and watches price reverse through their position.
Walkthrough: The Counter-Trend Trap
You spot a demand zone from a previous higher low. Price taps into it. You enter long with a 40-pip stop and a 100-pip target, aiming for the strong high.
But the internal order flow is bearish. The swing order flow is bearish. Both levels of structure say sellers are in control. Price gives you a 20-pip bounce (the pullback), then rolls over and takes your stop.
The correct play: recognize that demand zone as a pullback fuel point, not a trade signal. Wait for price to use it, pull back into the supply range above, and then short after the internal break of structure confirms continuation.
If you want to trade against the flow, you must do it at the very start of a pullback with tight expectations. Targeting the strong high when both timeframes are against you is how accounts bleed.
Sound familiar? Most traders have done exactly this.
Focus on What Price Is Doing Right Now
Analysis paralysis happens when you try to account for every zone, every structure point, and every historical level on the chart.
The fix is simple. Focus on the current internal range.
If price is trading within the current internal structure (between the last internal higher low and the most recent high), map that range. Draw the relevant supply and demand ranges within it. Forget what price did weeks ago. It does not help you right now.
Practical rule: if a zone has been mitigated (price already passed through it), it has already done its job. Stop treating it as a future point of interest. Map only unmitigated zones near current price.
This keeps your chart clean and your decision-making fast. Two or three zones on a chart is workable. Twelve zones is a recipe for hesitation.
When you backtest this approach, you will find that the simplicity of focusing on current structure eliminates most of the indecision that causes late entries and missed exits.
The Alignment Rule: When All Stars Line Up
The highest-probability trade setups happen when every level of order flow points in the same direction.
For a bearish example:
Swing order flow is bearish (lower highs, lower lows).
Internal order flow has shifted bearish (market shift confirmed).
Price has pulled back to a supply range or flip zone.
A smaller fractal structure on a lower timeframe has also shifted bearish.
When all four conditions are met, you have maximum structural alignment. This is where you enter with confidence and target the weak low.
Document this exact checklist in your trading playbook so you have it visible during execution. Writing it down once is not enough. You need it next to your chart when the trade is live.
For a bullish version, flip everything. Swing order flow bullish, internal order flow shifted bullish via market shift, price at a demand range, and fractal confirmation on the lower timeframe.
Fractal Market Shift vs Market Shift
These two get confused constantly, and the confusion causes real losses.
A fractal market shift is a structural break on a very small timeframe (one or two candles). It tells you that a pullback is starting or ending on the internal level. It does NOT confirm that the internal structure has shifted.
A market shift is a structural break where price closes past the last significant higher low or lower high. This confirms a real shift in internal order flow direction.
The mistake: treating a fractal market shift as if it is a market shift. A trader sees a tiny bearish break and assumes the internal flow has flipped. They short. Price bounces off a demand range (because the internal flow is still bullish), and the trade fails.
The rule: if you want higher win rates, wait for the market shift, not the fractal. The fractal gets you in earlier but with lower probability. The market shift gets you in slightly later but with confirmation that the flow has actually changed.
How EdgeFlo Supports Order Flow Execution
Reading order flow is one thing. Executing on it with discipline is another. EdgeFlo's auto risk calculator sizes your position directly from your stop distance, so when you identify that supply range entry with a 30-pip stop, the lot size is calculated for you. No manual math under pressure.
The guardrail system restricts trading when you hit your daily loss limit, which matters on days when your order flow read is wrong and you take consecutive losses. You can override the guardrail if you choose to, but the restriction makes the decision conscious rather than automatic.
Use the Edge plan builder to document your order flow checklist (swing range mapped, internal flow tracked, market shift confirmed, alignment verified). Having that checklist stored and visible during execution is the difference between following your process and improvising under pressure.
The Edge Brief
Receive Insights on trading psychology, discipline, and the behavioral patterns that create consistent traders from our Founder and the EdgeFlo team, delivered to your inbox.
Think different. Trade different.
What is order flow trading?
Do I need special tools for order flow trading?
How do I know when order flow shifts from bullish to bearish?
What is the difference between internal and swing order flow?

Turn discipline on.
Every session.
EdgeFlo is the environment serious traders operate inside.
Start 7-Day Trial — $7
Cancel anytime.
No long-term commitment.


Think Different, Trade Different.