

Order Flow Pullback: Time the Continuation Entry
Order flow pullbacks test whether the trend is alive. Learn to read internal structure during pullbacks and time your continuation entry before the next leg.

A pullback is not a reversal. But it sure feels like one when you are watching it happen in real time.
Price just broke structure to the downside. You are bearish. Then price starts climbing, making higher highs and higher lows on the internal structure. Candle after candle going against your bias. The question hits: did the trend actually change?
Almost always, no. What you are watching is the internal order flow turning temporarily bullish to facilitate a pullback to the previous supply range. Once that pullback completes, the bearish swing order flow resumes. The trick is knowing when the pullback is over and timing your continuation entry before the next leg starts.
TL;DR
Pullbacks are temporary shifts in internal order flow that move price against the swing direction.
The internal order flow turns opposite to the swing trend specifically to facilitate the pullback.
The pullback targets the supply or demand range from the previous break of structure.
Wait for the internal order flow to shift back to the swing direction before entering.
Entering during the pullback (counter-trend) is possible but carries significantly more risk.
Why the Internal Order Flow Flips During Pullbacks
After a bearish break of structure, price needs to retrace. That retracement requires buying pressure to push price back up toward the supply range. So the internal order flow shifts bullish: higher highs, higher lows on the internal structure.
This confuses traders who only look at one timeframe. They see bullish internal structure and think the trend has changed. But the swing order flow has not shifted. The strong swing high has not been broken. The internal bullish move is happening inside a bearish swing range.
The same thing happens in a bullish trend. After a bullish BOS, the internal order flow might turn bearish temporarily as price pulls back to the demand range. Lower highs, lower lows on the internal structure, but the swing trend is still bullish.
Understanding this relationship between swing and internal order flow is the key to timing continuation entries within your market structure. You are not fighting the pullback. You are waiting for it to finish.
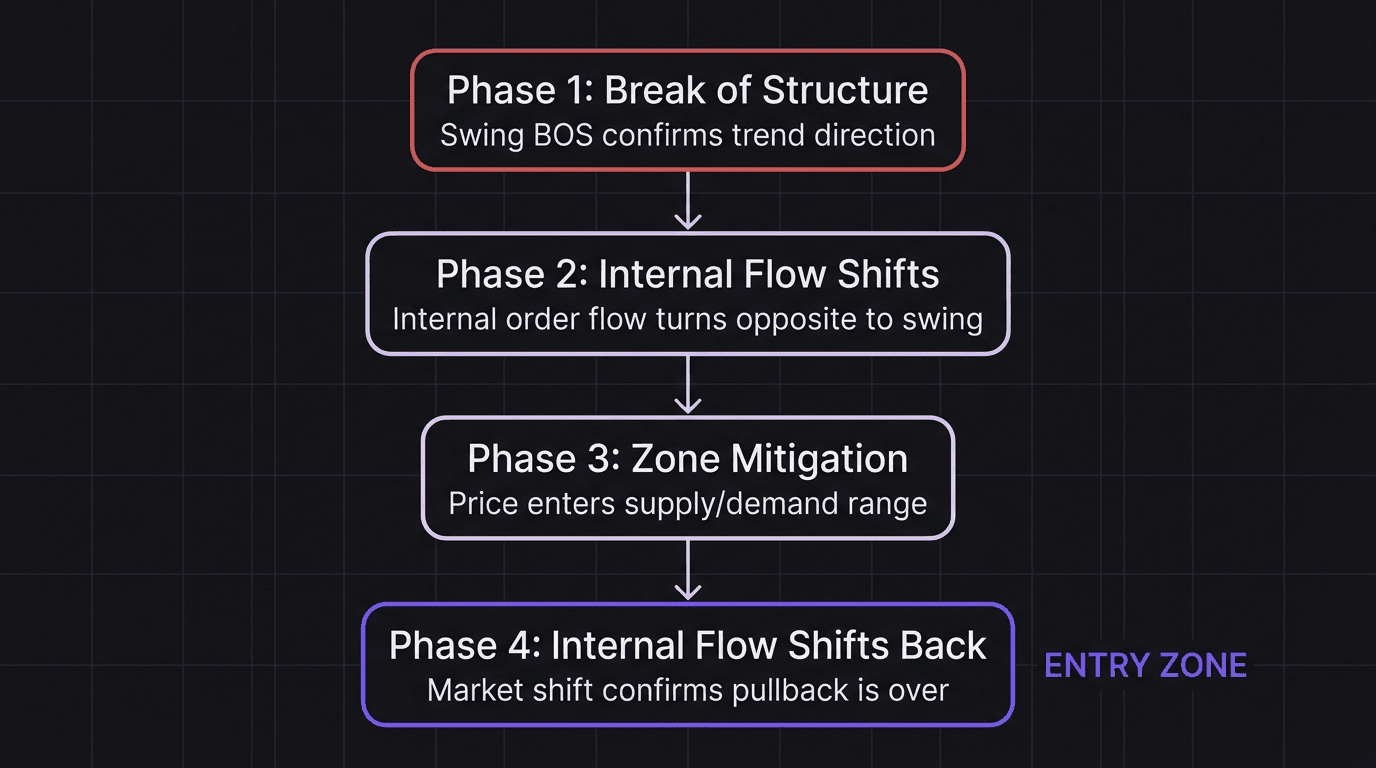
The Pullback Lifecycle: 4 Phases
Every order flow pullback follows the same structural lifecycle. Knowing the phases helps you identify where you are and what comes next.
Phase 1: Break of Structure
The swing trend creates a new break of structure. In a bearish trend, price breaks below the last swing low. This confirms the direction and creates the supply range from the swing high to the swing low.
Phase 2: Internal Flow Shifts
After the break, price starts retracing. The internal order flow shifts to the opposite direction. In a bearish swing trend, the internal flow turns bullish. You see higher highs and higher lows forming as price climbs toward the supply range.
This is the pullback in progress. The closer price gets to the supply range, the higher the probability that the pullback is nearing completion.
Phase 3: Zone Mitigation
Price enters the supply or demand zone from the previous break. In a bearish pullback, price enters the supply range. The remaining sell orders in this zone get mitigated. This is where the swing trend has the opportunity to reassert itself.
But entering a zone does not mean automatic reversal. The internal order flow is still opposite to the swing trend at this point. You need confirmation.
Phase 4: Internal Flow Shifts Back (The Entry Signal)
The internal order flow shifts back to the swing direction. In a bearish scenario, the last internal higher low breaks to the downside. That market shift confirms the pullback is over and the bearish swing order flow is resuming.
This is your continuation entry. Both the swing and internal order flow are now aligned. The supply zone has been mitigated. The structure is clear.
Walkthrough: Bearish Continuation After a Pullback
You are watching AUD/USD on the 1-hour chart. The swing structure is bearish. Price broke below 0.6520 (the last swing low), creating a bearish BOS. The strong swing high is at 0.6580 and the weak swing low is at 0.6500.
Phase 1 complete. The break is confirmed. The supply range runs from 0.6580 down to 0.6520.
Price starts climbing. Internal structure: bullish. Higher highs and higher lows form as price retraces upward. You mark the internal higher lows and higher highs.
Phase 2 in progress. The pullback is happening.
Price reaches the supply range around 0.6550. It enters the zone and stalls. The internal order flow is still bullish at this point.
Phase 3. Zone mitigation is occurring.
Then the internal structure breaks. The last internal higher low at 0.6540 gets taken out with a body close. The internal order flow has shifted from bullish to bearish.
Phase 4 complete. The pullback is over. You see a new supply zone forming from the candle that caused the internal shift.
Your entry: short from the new supply zone after a small pullback into it. Stop loss above the supply range high at 0.6555. Target: the previous swing low at 0.6500. That is a 55-pip target with a 15-pip stop, giving you a 1:3.6 risk-to-reward ratio.
Math check: 0.5 lots on AUD/USD (pip value approximately $5 per pip at 0.5 lots). Stop: 15 pips = $75 risk. Target: 55 pips = $275 reward. Risk-to-reward: $275 / $75 = 3.67:1.
This is the highest probability entry in the order flow framework. Swing bearish, internal bearish, zone mitigated, confirmation received.
The Mistake: Entering Too Early
Same scenario, but you enter short the moment price touches the supply range at 0.6550. The internal order flow is still bullish. Price reacts from the supply zone for two candles, dropping 10 pips, then reverses and pushes another 20 pips higher into the zone.
Your stop at 0.6555 gets hit. Loss: 5 pips times $5 per pip at 0.5 lots = $25.
Was the analysis wrong? No. The supply zone was valid. The swing trend was bearish. But you entered before the internal order flow confirmed the shift. Price was still in Phase 3 (zone mitigation) and had not completed Phase 4 (internal shift back).
That 5-pip stop loss was too tight for a trade taken before confirmation. And even if you had used a wider stop, you were fighting the internal flow.
Counter-Trend Pullback Entries: Possible But Risky
Some traders want to trade the pullback itself, not the continuation after it. That means buying during a bearish pullback (trading with the internal bullish flow but against the swing bearish flow).
This can work. The best time to enter a counter-trend pullback trade is right at the start of Phase 2, right after the internal flow shifts to the pullback direction. You enter from a demand zone near the start of the pullback with a tight stop below the recent low.
But manage expectations. Your target is the supply range, not a new swing high. You are catching a temporary internal move, not a trend change. And the closer price gets to the supply range (where the swing trend can reassert itself), the more dangerous it becomes to hold the position.
Entering a counter-trend trade near the end of the pullback (when price is already deep in the supply range) is one of the most common ways to lose money. The internal flow is about to shift against you, and you are buying at the worst possible location.
Reading the Depth of the Pullback
Not every pullback reaches the full supply or demand range. Some pullbacks are shallow: price retraces to the 50% level of the swing range and then continues. Others are deep: price pushes all the way to the extreme end of the zone.
You cannot predict the depth in advance. But you can watch for signs.
If price enters the supply range and the internal order flow shifts bearish quickly (within a few candles of entering the zone), the pullback is shallow and the continuation is strong. The bearish pressure is overwhelming the remaining buy orders.
If price enters the supply range and the internal flow stays bullish, pushing deeper and deeper into the zone, the pullback is deep. The supply range might get fully mitigated before the reversal. In that case, look for the market shift near the extreme end of the supply range.
The key is patience. Whether the pullback is shallow or deep, the entry signal is the same: wait for the internal order flow to shift back to the swing direction. The depth just changes where your entry zone forms.
How EdgeFlo Supports Pullback Trading
EdgeFlo's auto risk calculator sizes your position based on the distance from entry to stop loss. When you are trading pullback continuations, your stop is typically above (or below) the supply or demand range. That distance changes depending on pullback depth. The calculator adjusts your lot size so you maintain consistent risk regardless of how deep the pullback goes.
EdgeFlo's Edge plan builder lets you document your pullback rules as a written plan. "Only enter continuation after Phase 4 internal shift" becomes a visible rule next to your chart. After each trade, the self-reporting feature lets you log whether you followed the rule or jumped the gun, building accountability data over time.
The Edge Brief
Receive Insights on trading psychology, discipline, and the behavioral patterns that create consistent traders from our Founder and the EdgeFlo team, delivered to your inbox.
Think different. Trade different.
What is an order flow pullback?
How do I know when a pullback is over?
Should I trade during the pullback or wait for continuation?
What zone should I look for during an order flow pullback?

Turn discipline on.
Every session.
EdgeFlo is the environment serious traders operate inside.
Start 7-Day Trial — $7
Cancel anytime.
No long-term commitment.


Think Different, Trade Different.