

Internal Structure Trading: Time Your Entries
Internal structure controls the timing of your trades. Learn how internal BOS confirms pullbacks and gives you precise entries between swing points.

Internal structure trading is how you time your entries between swing points. Swing structure tells you the direction. Internal structure tells you when to pull the trigger. It tracks the smaller highs and lows that form within each swing leg, and when internal structure shifts, it confirms whether a pullback is starting, finishing, or turning into something bigger. If you are trading with the swing trend but your entries keep getting stopped out, the problem is almost always internal structure: you are entering before the pullback is confirmed or after the move has already left without you.
TL;DR
Internal structure tracks highs and lows between swing points, not the major turning points.
Internal BOS requires a body close, same rule as swing BOS.
Internal shifts during a pullback are normal and expected. They do not break the swing trend.
The best entries happen when internal structure shifts back in the direction of the swing trend.
Ignoring internal structure means guessing on entry timing.
Internal Structure Defined
Internal structure is the substructure within a swing leg. If swing structure is the frame of a building, internal structure is the floor plan inside each room.
Between any two swing points, price does not move in a straight line. It pushes, pulls back, pushes again, and pulls back again. Those smaller highs and lows inside the swing leg are your internal structure.
In a bullish swing leg (price moving from a swing low toward a new swing high), internal structure shows you the mini higher highs and higher lows within that move. In a bearish swing leg, it shows you the mini lower highs and lower lows.
The rules for internal structure breaks are the same as swing: a candle body must close past the internal level for it to count as a break of structure (BOS). Wicks do not count. This keeps the process mechanical and prevents you from reacting to noise.
Why does internal structure matter? Because it is the layer that controls your entry timing. You might know the swing trend is bullish, you might have a supply and demand zone marked for your entry, but if you enter before internal structure confirms the pullback is done, you will often watch price keep pulling back right through your position.
Internal vs Swing Structure
The confusion between internal and swing structure causes more bad trades than almost anything else. Here is how they differ in practice.
Swing structure is the big picture. It defines the trend. Higher highs and higher lows on swing = bullish. Lower highs and lower lows on swing = bearish. Swing points are the major turning points that started significant moves. When swing structure breaks, the entire trend has changed.
Internal structure lives inside the swing. It moves faster, shifts more often, and tells you about the current momentum within the swing leg, not the trend itself. When internal structure shifts against the swing trend, it does not mean the trend is over. It means a pullback is happening.
This distinction is critical: an internal market shift is not a reversal signal. It is a pullback signal.
Here is a practical way to tell them apart. Look at the market structure on your chart. The highs and lows that connect to form the major zigzag pattern? Those are swing. The smaller highs and lows that happen between those major points? Those are internal.
A common mistake: treating every internal shift as a reason to flip your bias. If swing structure is bullish and internal structure just shifted bearish, the correct response is not "the trend has changed." The correct response is "a pullback has started, and I should wait for internal structure to shift back bullish before entering long."
Think of it this way. Swing structure is your compass. It points you in the right direction. Internal structure is your GPS. It tells you when to turn.
How Internal BOS Confirms the Pullback
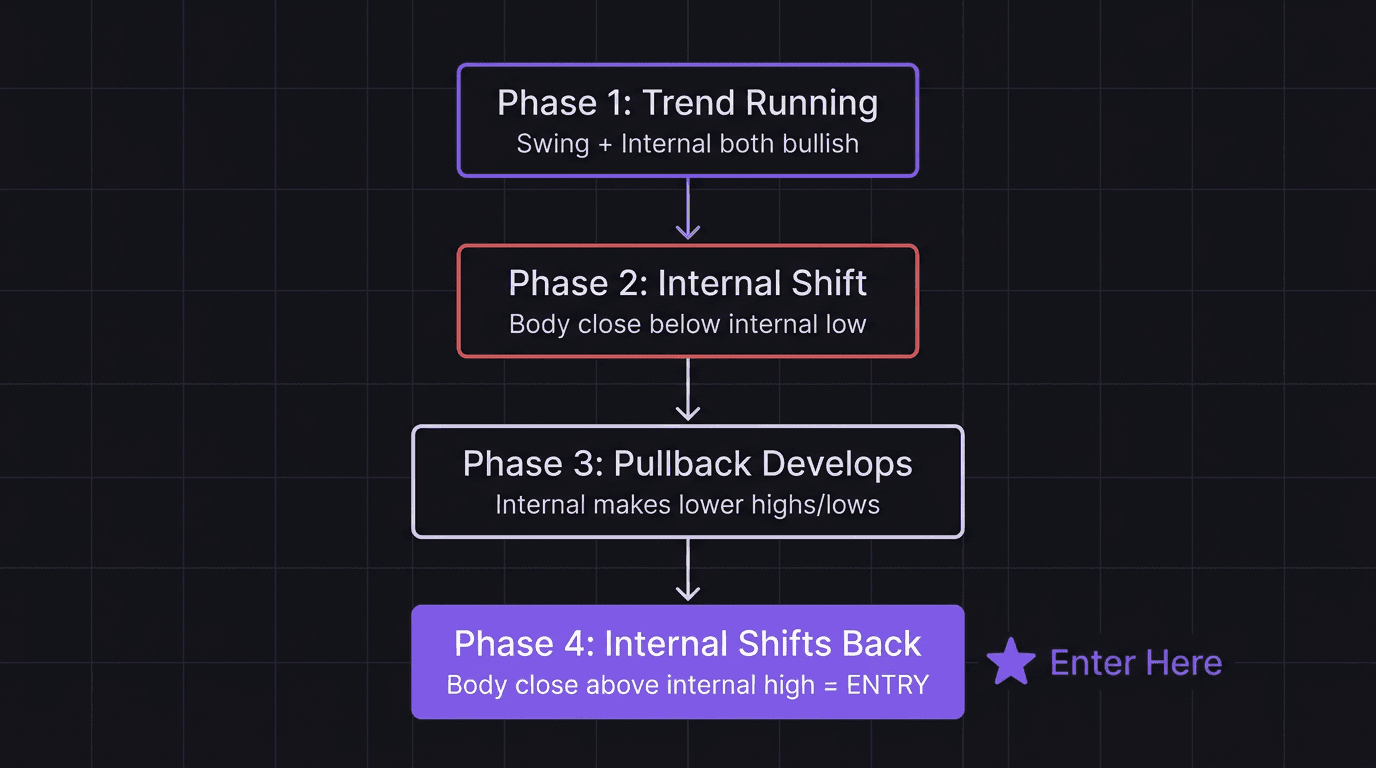
When a pullback happens within a trend, internal structure is the confirmation tool. Here is the sequence.
Phase 1: Trend is running. Swing structure is bullish (HH/HL). Internal structure is also bullish, pushing price toward a new swing high. Everything is aligned.
Phase 2: Internal shift. Price makes an internal lower high and then breaks an internal low with a body close. Internal structure has shifted bearish. This means the pullback has started. Price is now moving against the swing direction.
Phase 3: Pullback develops. Internal structure remains bearish as price makes internal lower highs and lower lows. Price is retracing into the premium and discount zones you have mapped.
Phase 4: Internal shift back. Price reaches a demand zone, rejects, and makes an internal higher low followed by a body close above the previous internal high. Internal structure has shifted back to bullish. This is your signal.
Phase 4 is where you enter. Internal structure has realigned with swing structure. The pullback is confirmed as complete (or at least pausing), and you have evidence that buyers are stepping back in.
Example: GBP/USD 1H chart, bullish swing structure.
Swing low at 1.2680, previous swing high at 1.2750. Price is pulling back after making a new swing high at 1.2780.
Internal structure shifts bearish: price makes an internal lower high at 1.2765 and closes its body below the internal low at 1.2740. The pullback is confirmed.
Price continues lower, making internal lower lows. It reaches a demand zone at 1.2700 (near the kill zone timing at London open).
Internal structure shifts back bullish: price makes an internal higher low at 1.2705 and closes its body above the internal high at 1.2725. The pullback is done.
A trader enters long at 1.2728 with a stop below the internal higher low at 1.2700 (28 pips risk). Target is the previous swing high at 1.2780 (52 pips), giving roughly a 1.85:1 reward-to-risk.
The timing of this entry is entirely dependent on internal structure. Without it, the trader would be guessing whether the pullback to 1.2700 was over or just getting started.
Trading Within the Internal Range
Once you understand internal structure, you can define exactly where you should be looking for trades and where you should be sitting on your hands.
The internal range is the space between the most recent internal high and internal low. This range tells you the current battlefield. Buyers and sellers are fighting for control within these boundaries.
When to Trade
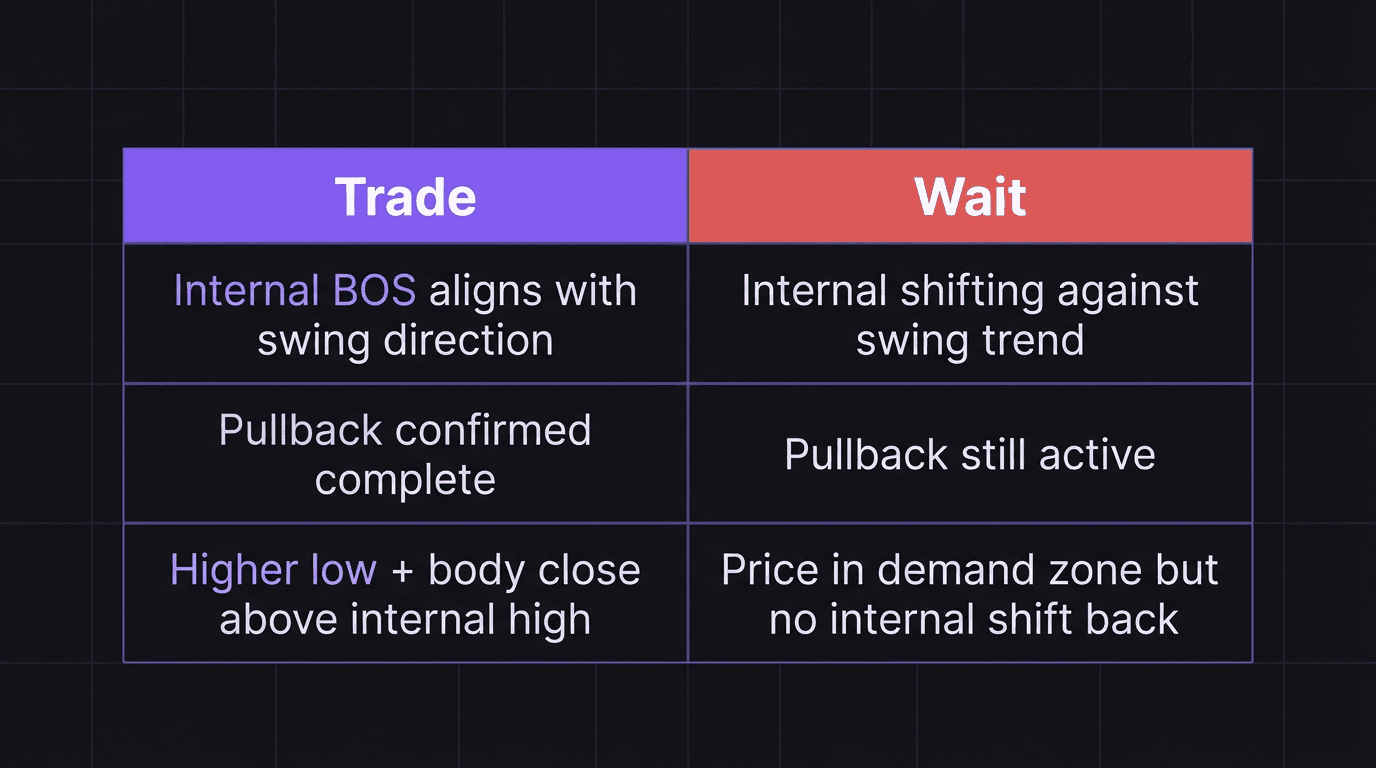
You trade when internal structure shifts in the direction of the swing trend. That shift confirms that one side has won the internal battle and momentum is realigning with the bigger picture.
Build this into your trading playbook as a specific rule: "I only enter when internal BOS aligns with swing direction." No exceptions. No "this time it looks like it might work without confirmation."
When to Wait
You wait during two specific situations:
Situation 1: Internal structure is shifting against the swing trend. The pullback is actively happening. You do not know how deep it will go. Entering long during a bearish internal shift in a bullish swing is catching a falling knife.
Situation 2: Internal structure has not yet confirmed a shift back. Price might be sitting in a demand zone, and it might look like the pullback is over. But until internal structure shows you a higher low and a break above the internal high, you do not have confirmation. Wait.
What NOT to do: USD/JPY 15M chart.
Swing structure is bearish. Price is pulling back (internal structure is bullish, pushing price higher within the bearish swing leg). A trader sees price reach a supply zone at 151.40 and immediately goes short, expecting the pullback to end.
But internal structure has not shifted back to bearish. Price continues to 151.65 before finally making an internal lower high and breaking the internal low at 151.30. The trader who waited for the internal shift enters short at 151.28 with a clean setup. The trader who entered at 151.40 without confirmation either got stopped out at 151.65 or is sitting in drawdown.
Managing the Internal Range in Real Time
Keep your internal levels updated as new highs and lows form. Internal structure moves fast. A level that was relevant 10 candles ago might have been replaced by a newer, more meaningful internal high or low.
Mark only the most recent internal high and internal low. That is your active range. If price breaks one side, update the level. If a new swing point forms, your internal levels reset because you are now in a new swing leg.
This constant updating is work. But it is the kind of work that separates traders who time their entries well from traders who enter and hope.
How EdgeFlo Supports Internal Structure Trading
EdgeFlo helps you track internal structure shifts by keeping your plan rules visible during live trading. You write down your internal BOS rules once, and they stay next to your chart every session. No more forgetting to check internal structure because the market is moving fast.
The journal captures where you entered relative to your mapped internal levels. After each week, you can review whether your entries aligned with internal BOS or whether you skipped the confirmation step. That pattern recognition, based on your own data, is how you stop repeating the same timing mistakes.
EdgeFlo's pre-session prompts can include your internal structure check. Before you take any trade, the system asks whether internal structure aligns with swing. It is a small friction that prevents big mistakes.
The Edge Brief
Receive Insights on trading psychology, discipline, and the behavioral patterns that create consistent traders from our Founder and the EdgeFlo team, delivered to your inbox.
Think different. Trade different.
What is internal structure in trading?
How does internal BOS differ from swing BOS?
Can internal structure shift while swing structure stays bullish?
When should you enter a trade based on internal structure?

Turn discipline on.
Every session.
EdgeFlo is the environment serious traders operate inside.
Start 7-Day Trial — $7
Cancel anytime.
No long-term commitment.


Think Different, Trade Different.