

Non-Textbook Price Action: Trade What Actually Shows Up
Real charts rarely look like textbook examples. Learn to trade messy structure: consolidation inside pullbacks, choppy BOS, and imperfect setups that still pay.

You learn order flow from clean diagrams. Price pushes down, pulls back in a smooth arc, then continues down after a single break of structure. Three swings, one entry, textbook result.
Then you open a real chart and nothing looks like that.
The pullback has a consolidation stuck in the middle of it. The break of structure takes three candles instead of one clean close. The demand zone you mapped gets tapped, reacts, fails, then taps again from a deeper level before the move finally starts.
This is not broken price action. This is normal price action. The textbook version is the simplified model. What shows up on your chart every day is the real thing, and if you cannot trade messy structure, you cannot trade consistently.
TL;DR
Real charts include consolidation, overlapping structure, and unclean breaks that textbooks skip.
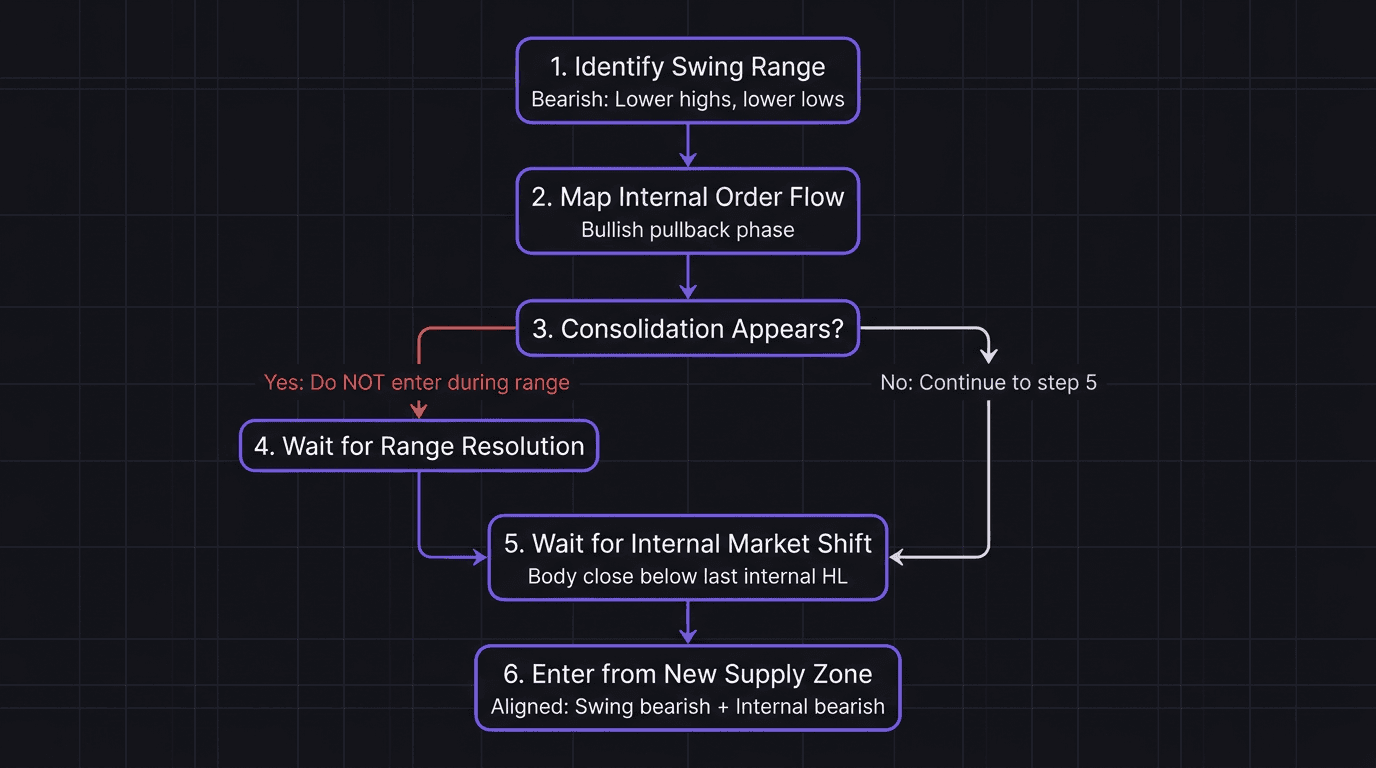
The framework still works: identify the swing range, map internal order flow, wait for confirmation.
Consolidation inside a pullback does not invalidate the pullback; it just delays the resolution.
The highest probability entries happen after the mess clears, not during it.
Trading messy structure requires patience, not a different strategy.
The Gap Between Education and Execution
Every market structure course shows the same thing: clean higher highs, clean higher lows, one crisp break of structure, one demand zone, one entry. That is how you learn the concept. But it creates an expectation that real charts should look that clean.
They do not. Ever noticed how your analysis looks perfect on Saturday during review, but Monday morning the chart looks like someone scribbled on it? That is not bad luck. That is the gap between educational diagrams and live price delivery.
The good news: the same systematic framework applies to messy charts. You still identify your swing range. You still map internal order flow. You still wait for confirmation. The difference is that each step takes longer and looks less pretty.
What Makes Price Action "Non-Textbook"
Three things create the mess on real charts.
Consolidation Inside Pullbacks
In a textbook bearish scenario, price breaks structure, pulls back smoothly to the supply range, and continues down. On a real chart, the pullback might stall halfway. Price enters a tight range, bouncing between a small supply and demand zone for 8 to 12 candles before finally resolving.
This is consolidation inside the pullback. The pullback is still happening. The internal order flow is still bullish (because price is pulling back in a bearish swing trend). But instead of a clean arc, you get a sideways pause in the middle.
The mistake traders make is entering during the consolidation. They see a demand zone react inside the range and jump in long. Then price chops them out. Or they see a supply zone react and go short, only to watch price push higher out of the range.
The fix: wait for the consolidation to resolve. Let price break out of the range and confirm direction with an internal break of structure. The consolidation is just a pause, not a reversal.
Overlapping Internal Structures
On lower timeframes, what looks like one clean internal swing leg might actually contain its own internal structure. A higher timeframe run is a lower timeframe trend.
So within one bullish internal leg (say, from an internal higher low to the next higher high), the lower timeframe might show its own sequence of higher highs and higher lows, with its own supply and demand zones creating its own mini-pullbacks.
This creates visual noise. You see candles going up, down, sideways, and it looks chaotic. But zoom out one timeframe and the structure is clean. That is why swing structure matters as your anchor. When the lower timeframe looks noisy, the higher timeframe usually still makes sense.
Imperfect Breaks of Structure
A clean BOS is one candle breaking and closing past the last swing point. Real charts give you wicks that pierce the level and close back inside. Or two candles that break the level with their bodies but the third candle pulls right back.
These imperfect breaks create confusion. Is the structure broken or not? Did the order flow shift?
The rule stays the same: a body close past the level confirms the break. A wick alone does not. If you see a wick break and a quick rejection, that is likely a liquidity sweep, not a structural break. Stay patient. Wait for the clean close.
Walkthrough: Bearish Continuation Through the Mess
You are looking at GBP/USD on the 1-hour chart. The swing structure is bearish, with a strong swing high above and a weak low below that just got broken.
Price starts pulling back into the supply range. The internal order flow shifts bullish (higher highs and higher lows on the internal structure). So far, textbook.
Then price enters the supply range and stalls. Instead of immediately shifting bearish, it consolidates. For 10 candles, price bounces between a small internal range. You can see supply reactions on the left side of the range and demand reactions on the right.
Here is where most traders lose money. They sell from the supply reaction inside the range. Price drops 15 pips, then bounces right back up. Or they buy from the demand side and price drops through it.
You wait. You watch the internal order flow. It is still technically bullish because the last internal higher low has not been broken yet. The consolidation is noise inside the pullback phase.
Eventually, price pushes up out of the consolidation and taps deeper into the supply range. Then you see it: a candle breaks and closes below the last internal higher low. That is the market shift. The internal order flow has shifted from bullish to bearish.
Now you have alignment. Swing order flow: bearish. Internal order flow: bearish (just shifted). You look for the supply zone that formed from the market shift candle, wait for a pullback into it, and enter short.
Your stop goes above the supply range high. Your target is the previous swing low. That is a 1:2.5 risk-to-reward setup.
The entry was not clean. The consolidation added 10 candles of dead time. But the framework still worked because you waited for the structural confirmation instead of guessing inside the mess.
Walkthrough: The Mistake of Forcing Textbook Rules
Same chart, earlier in the week. You saw the swing structure was bearish and price was near a supply zone. Perfect setup on paper. But the internal order flow was still bullish, with price actively making higher highs and higher lows.
You entered short at the supply zone because "the swing trend is bearish and price reached supply." Textbook logic, right?
Price reacted from the supply zone for one candle, then pushed right through it. The internal bullish order flow was still intact. The supply zone was only facilitating a small internal pullback before price continued higher.
The lesson: textbook rules still apply, but you cannot skip the confirmation step. The supply zone was real. The swing trend was bearish. But the internal flow was still bullish, which meant the pullback was not over yet. Entering short before the internal shift is fighting the current flow.
Focus on What Price Is Doing Right Now
One of the biggest sources of analysis paralysis on messy charts is trying to account for every zone, every break, and every structure from the past 200 candles.
Stop. Focus on the current internal range. What is the last internal high and low? What is the current order flow direction? Where is the nearest relevant zone?
If price is inside an internal range between a higher low and a recent high, that is your world right now. Do not worry about zones from three days ago unless they are immediately adjacent. The zones that matter are the ones price is currently interacting with.
When you focus on the current structure, messy charts become manageable. You are not trying to decode the entire history. You are reading one sentence at a time.
This is where having a proven edge makes the difference. When you trust your framework, messy candles do not create panic. They create patience. You know the setup will eventually form, because the market always resolves consolidation into trend continuation or reversal. You just have to wait for it to tell you which one.
How to Practice Trading Messy Structure
Backtesting is useful, but it can reinforce the textbook bias if you only select clean examples. Instead, deliberately seek out the messy sections of your backtesting data.
Find pullbacks that include consolidation. Find breaks of structure that took three candles instead of one. Find zones that got tapped twice before the reaction came. Those are the scenarios that will show up in live trading, and they are the ones you need reps on.
When you review a messy scenario in backtesting, ask two questions: "Where was the confirmation?" and "What would have happened if I entered before confirmation?" That contrast builds the patience muscle faster than anything else.
How EdgeFlo Helps You Trade Messy Charts
When price is consolidating inside a pullback and you feel the itch to enter, EdgeFlo's guardrails make impulsive trades harder. If you have set a maximum number of trades per day or a risk-per-trade limit, the guardrail warns you before you fire off a position into the mess. You can still override it, but you have to make the conscious choice.
EdgeFlo's trade plan builder (Edge) lets you document your non-textbook rules alongside your clean setup rules. Write the explicit criteria: "Do not enter during consolidation inside a pullback. Wait for internal market shift confirmation." Having that rule visible next to your chart during execution keeps you honest when the messy candles start creating pressure to act.
The Edge Brief
Receive Insights on trading psychology, discipline, and the behavioral patterns that create consistent traders from our Founder and the EdgeFlo team, delivered to your inbox.
Think different. Trade different.
Why does real price action look different from textbook examples?
How do I trade when price consolidates inside a pullback?
Should I skip trades that look messy on the chart?
What is the biggest mistake traders make with non-textbook setups?

Turn discipline on.
Every session.
EdgeFlo is the environment serious traders operate inside.
Start 7-Day Trial — $7
Cancel anytime.
No long-term commitment.


Think Different, Trade Different.