

News Trading: Why the Spike Is Always the Trap
FOMC, NFP, and CPI spikes are institutional liquidity events, not trade signals. Learn why the initial spike traps traders and how to trade the real move after.

FOMC drops. Price spikes 100 pips north in 30 seconds. You buy the breakout. Fifteen minutes later, price has reversed every single pip and is now 80 pips below where it started.
You just donated your capital to the smartest money in the room.
News events are not trading opportunities. They are institutional liquidity operations disguised as tradeable moves. The initial spike, the one that looks like a clear signal, is almost always the trap. The real move comes after.
TL;DR
News spikes (FOMC, NFP, CPI) are liquidity sweeps, not directional signals.
The initial move clears stop orders and pending entries from retail traders.
Good news can cause price to drop if the market already priced it in.
Wait 15 to 30 minutes after the release before considering any trade.
The real direction emerges in the second move, after the whipsaw settles.
Why News Spikes Move Both Directions in Seconds
Before a major news event, the market goes quiet. Price consolidates into a tight range as traders wait. Some traders place buy orders above the range and sell orders below it, hoping to catch whichever direction the news pushes. Others stack positions based on their forecast.
This pre-news range is a liquidity goldmine. Buy stops above. Sell stops below. Pending orders on both sides. When the news drops, the resulting spike does not move because of the news itself. It moves because the news provides the excuse to trigger all those orders simultaneously.
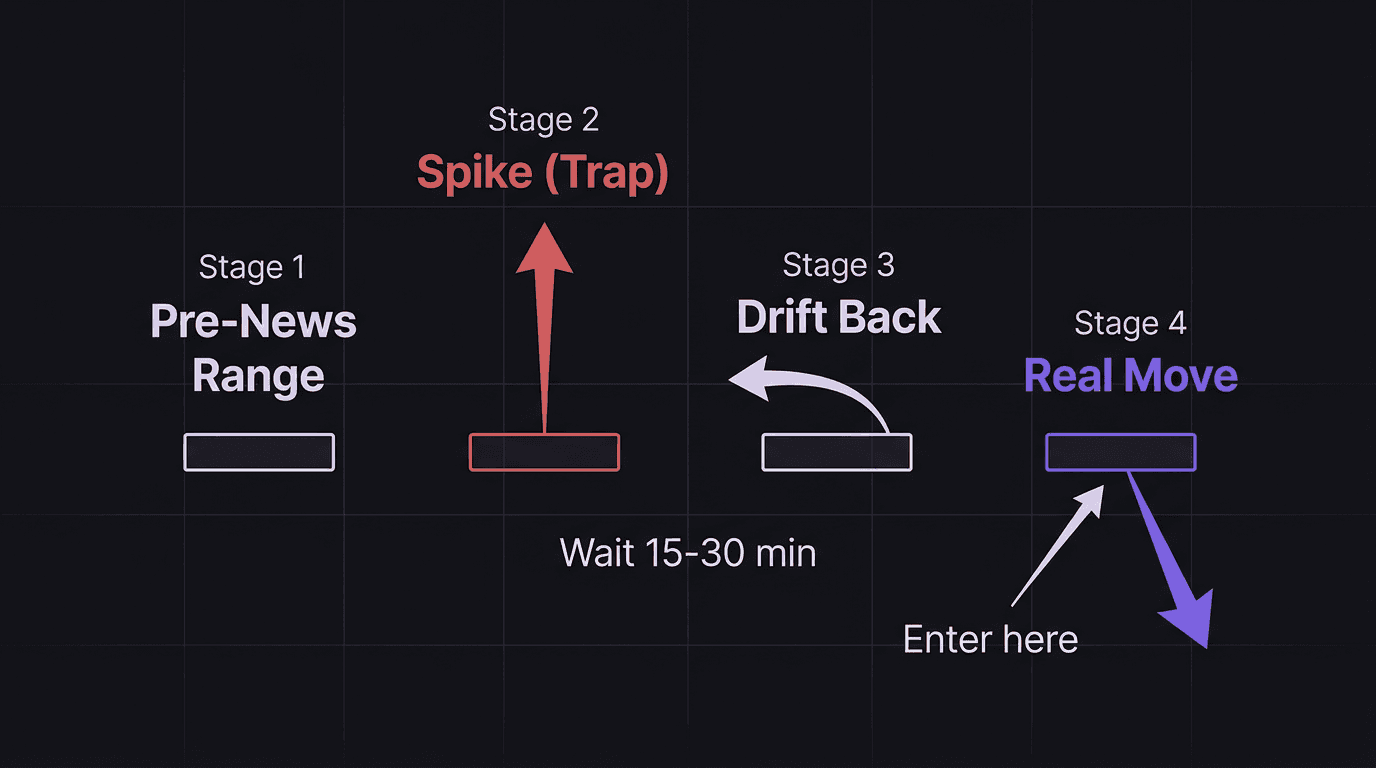
Here is the typical sequence:
News releases. Price spikes sharply in one direction (say, bullish).
The spike triggers all the buy stops above the pre-news range.
Those buy stops are now filled orders, and institutions sell into that demand.
Price stalls at the top of the spike.
Over the next 15 to 30 minutes, price gradually reverses.
The reversal accelerates as traders who bought the spike start losing and closing.
Price drops through the pre-news range, sweeps the sell stops below, and continues in the real direction.
This is the "fast liquidity sweep and slow drift" pattern. The spike is fast because it needs to trigger orders before anyone reacts. The reversal is slow because institutions are unwinding and repositioning. Then the real move is fast again.
The Institutional Playbook During News Events
Institutions do not gamble on news outcomes. They use news events as cover for order execution.
Think about the challenge an institution faces. They need to sell 500 lots of GBP/USD. If they dump 500 lots at market, price craters instantly and they get terrible fill prices. But if a news spike triggers thousands of retail buy orders at the exact moment the institution wants to sell, they get filled at premium prices against all that retail buying pressure.
The news spike is the delivery mechanism. The news itself is almost irrelevant.
This is why you see "good" news cause drops and "bad" news cause rallies. The market does not react to the news data. It reacts to the positioning. If everyone expected good data and positioned for it, the good data is already priced in. The release then becomes a liquidity event, not an information event.
Walkthrough: GBP/USD During FOMC
GBP/USD consolidates between 1.2650 and 1.2670 in the hour before FOMC. At 2:00 PM ET, the announcement drops. Price spikes to 1.2720, a 50-pip move in seconds. Breakout traders enter long at 1.2700 with stops at 1.2660 (40-pip risk, $400 per standard lot at $10/pip).
The spike candle closes at 1.2695. No follow-through. Over the next 20 minutes, price drifts back to 1.2670 and then to 1.2650. The traders who bought the spike are now underwater. By 2:45 PM, price breaks below 1.2650 and continues to 1.2580. The breakout traders get stopped out at 1.2660 for a $400 loss.
A trader following the second-move rule waits. At 2:25 PM, price is back at 1.2660 and structure on the 5-minute chart has shifted bearish. The trader enters short at 1.2660 with a stop at 1.2690 (30-pip risk, $300). Price drops to 1.2580, an 80-pip move. Reward: $800. R:R is 2.67.
Same event. One trader lost $400 chasing the spike. The other made $800 waiting for the real direction.
How to Read the Post-Spike Price Action
The 15 to 30 minutes after a news spike is where the real information lives. Here is what to look for:
The candle close. If the spike candle (the first big candle after the news) closes near its open or back inside the pre-news range, the spike was a sweep. If it closes strongly in the spike direction with a full body, the move may have follow-through.
The drift. After the spike, does price continue or does it drift back? A slow, grinding return toward the pre-news range is the institutional unwind. They are repositioning.
The second displacement. The real move is the second sharp push in the opposite direction of the initial spike. When you see a new displacement that breaks the pre-news range on the other side, that is the signal.
Volume pattern. The spike candle has huge volume (all those triggered orders). If the next few candles have declining volume while price drifts back, institutions are done with the sweep and preparing for the real direction.
Do not try to read the news headline for clues. The headline tells you what happened. Price action tells you what the market is doing about it.
Rules for Trading After the Whipsaw Settles
If you must trade around news, here are the rules:
1. No entries for 15 to 30 minutes after the release. This is your mandatory cooling period. Add it to your pre-market routine on news days.
2. Classify the spike as the first move. Label it as the sweep direction. Expect the real move to be opposite.
3. Wait for the structure shift. On a 5-minute or 15-minute chart, look for the second displacement to break the pre-news range in the opposite direction of the spike. That is your confirmation.
4. Enter on the retest. After the structure shift, price often pulls back to the origin of the displacement. Enter there with a tight stop beyond the pullback high or low.
5. Protect open positions before the event. If you have open trades, either tighten your stop to reduce exposure or close the position before the release. A 100-pip whipsaw can blow through a 20-pip stop in milliseconds. See news event stop loss strategies for specifics.
How EdgeFlo Protects Open Positions During News
News events do not announce themselves mid-trade. If you are in a position when FOMC hits, the spike can blow through your stop before you blink.
EdgeFlo's economic calendar is watchlist-aware, showing you upcoming events filtered to the pairs you actually trade. On Plus plans, the News Block guardrail can restrict new trade entries during high-impact news windows. You can override it (the override is always available), but the default is protection.
The pre-market routine built into EdgeFlo prompts you to check the economic calendar before you start trading. If NFP is in two hours, you see it before you enter a position. That one check saves more accounts than any technical setup.
After the event, your journal captures the trade data. Tag news-day trades separately and review them quarterly. Most traders find that their news-day entries have significantly worse stats than their non-news entries. When you see that in your own data, the rule to sit out the spike stops feeling like restraint. It feels like common sense.
Why does the news spike move in the wrong direction first?
How long should I wait after a news event before trading?
Can good news cause price to drop?
Should I close all trades before major news events?

Turn discipline on.
Every session.
EdgeFlo is the environment serious traders operate inside.
Start 7-Day Trial — $7
Cancel anytime.
No long-term commitment.


Think Different, Trade Different.