

Market Structure Shift vs Break of Structure: When to Enter
Learn the difference between a market structure shift and break of structure. Know when each one signals an entry and how to spot fake shifts.

Two traders look at the same chart. Both see price break above a recent high. One calls it a market structure shift and enters long. The other calls it a break of structure and waits for a pullback to a demand zone. They are using the same price data but reading two completely different signals. One is trading a reversal. The other is trading a continuation. If you mix these up, you enter at the wrong moment for the wrong reason.
A market structure shift (MSS) and a break of structure (BOS) are the two most important signals in price action trading. Getting them right means you know when the trend is changing and when it is continuing. Getting them wrong means you are the liquidity.
TL;DR
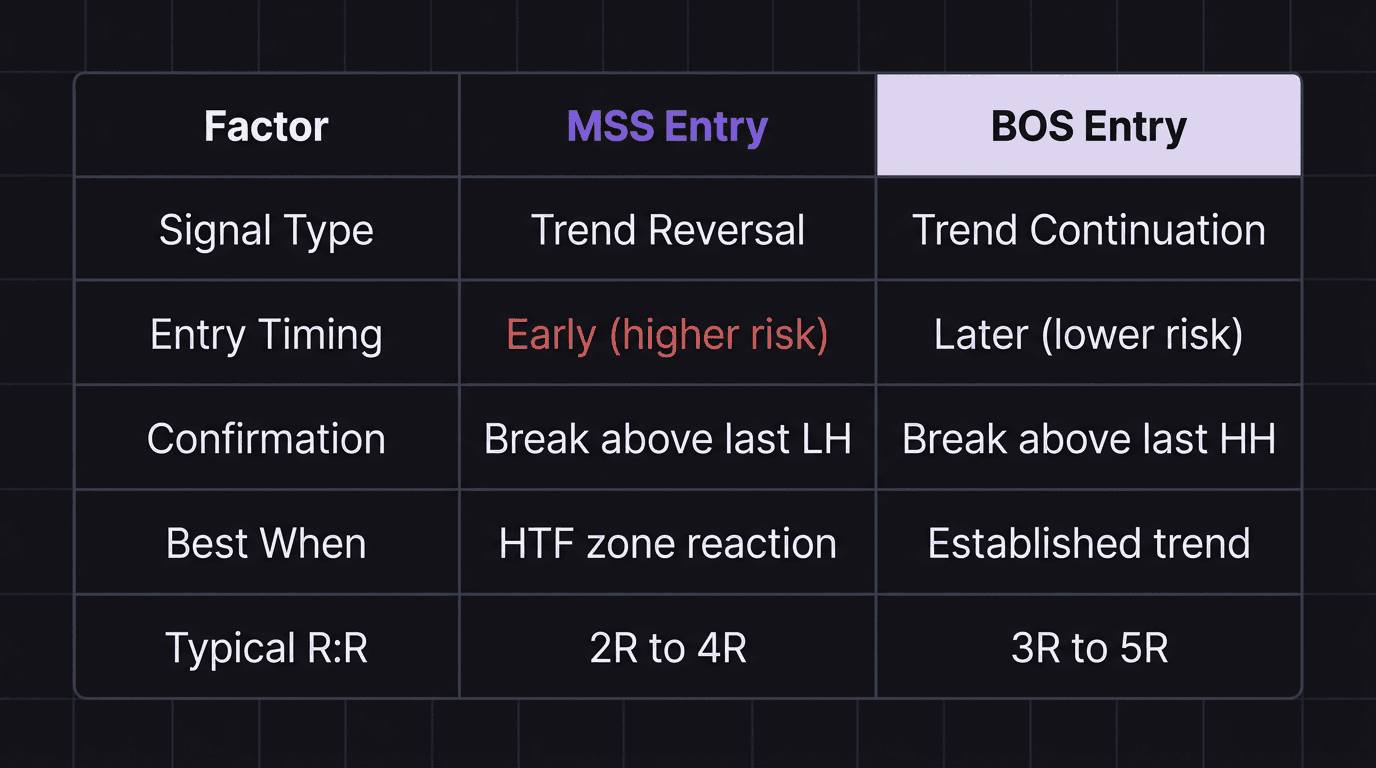
A market structure shift (MSS) signals a trend reversal. Price breaks above the last lower high in a downtrend or below the last higher low in an uptrend.
A break of structure (BOS) signals trend continuation. Price makes a new high in an uptrend or a new low in a downtrend.
Enter on an MSS when you want to catch the reversal early. Enter after a BOS when you want to ride the existing trend.
Fake market structure shifts trap traders who enter without waiting for confirmation.
Use your journal to track which signal type produces better results for your strategy.
What Is a Market Structure Shift
A market structure shift happens when the trend changes direction. In a downtrend, price makes lower highs and lower lows. The MSS occurs when price breaks above the last lower high. That break tells you the sellers who were pushing price down have lost control.
Here is the sequence in a bearish-to-bullish MSS:
Price is in a downtrend: lower high, lower low, lower high, lower low.
Price reaches a demand zone or point of interest and reacts.
Buyers push price up past the most recent lower high.
That break above the lower high is the MSS.
The MSS does not mean the reversal is guaranteed. It means the current bearish structure is broken. The sellers failed to defend their last swing point. Order flow has shifted, at least temporarily.
After the MSS, you are looking for two things: the flip zone that formed at the reaction point, and the demand zone or order block that caused the break. Either of these can serve as your entry on the pullback.
What Is a Break of Structure
A break of structure is simpler. It confirms that the existing trend is still intact and has just made a new leg.
In a bullish trend, price makes higher highs and higher lows. When price pushes above the last swing high, that is a BOS. It tells you buyers are still in control and the trend continues.
The BOS matters for entries because of what happens after. When price breaks to a new high in an uptrend, it often pulls back to the demand zone that launched the move. That pullback is your entry opportunity. You are not catching a reversal. You are joining an established trend at a discount.
The key difference from an MSS: a BOS moves in the same direction as the existing trend. An MSS moves against the existing trend. If you are in a downtrend and price breaks below the last swing low, that is a BOS (continuation lower). If price breaks above the last lower high, that is an MSS (potential reversal).
Shift vs Break: When Each One Matters
Choosing between MSS and BOS entries depends on where you are in the market cycle and what your higher timeframe is telling you.
The higher timeframe shows price reaching a major zone (demand in a downtrend, supply in an uptrend).
You see a failed reaction at a supply or demand zone that creates a flip.
You want to catch the early part of a new trend.
Your trading plan includes reversal entries.
The higher timeframe trend is clearly established and you want to join it.
Price has already shifted structure and is now making new highs or lows in the new direction.
You prefer continuation trades with confirmed momentum.
Your plan targets the pullback after a break of structure.
Neither is better in isolation. MSS entries catch bigger moves when they work because you enter earlier. But they have a higher failure rate because you are trading against the prior trend. BOS entries are safer because the trend has already proven itself, but you enter later and leave some profit on the table.
Walkthrough: MSS vs BOS on the Same Chart
EUR/USD is in a downtrend on the 4-hour chart with lower highs at 1.0900, 1.0860, and 1.0830. The last lower low is at 1.0780. Price drops to 1.0760 and reacts from a daily demand zone.
The MSS: Price rallies from 1.0760 and breaks above 1.0830 (the last lower high). This is the market structure shift. The entry is on the pullback to the flip zone between 1.0780 and 1.0800. You enter at 1.0795, stop at 1.0755 (below the swing low), target at 1.0900 (the next swing high).
That gives you a 40-pip stop and a 105-pip target: 2.625R. On 0.5 lots ($5 per pip), you risk $200 for a potential $525.
The BOS: After the MSS, price rallies to 1.0900 and pulls back. It finds demand at 1.0840 and pushes to 1.0920, breaking above 1.0900 (the previous swing high). That is the BOS. Now the uptrend is confirmed. You wait for the pullback to the demand zone at 1.0870 (where the higher low formed). You enter at 1.0870, stop at 1.0835, target at 1.0980.
That gives you a 35-pip stop and a 110-pip target: 3.14R. On 0.5 lots ($5 per pip), you risk $175 for a potential $550.
The MSS entry caught the move from 1.0795. The BOS entry joined at 1.0870, 75 pips later, but with a tighter stop and confirmed direction. Both are valid. The right choice depends on your plan.
Spotting Fake Market Shifts
Not every break above a lower high is a real MSS. Price can pierce the level, trigger buy orders, and immediately reverse. This is a fake market structure shift, sometimes called an inducement or a trap.
Fake MSS patterns happen because liquidity sits above swing highs. Retail traders place buy stop orders above lower highs, expecting the breakout. Smart money knows this. They push price above the level just far enough to trigger those orders, then sell into the liquidity and drive price to new lows.
Here is how to filter fake shifts:
Check the higher timeframe. If the 4-hour chart shows price deep inside a supply zone with bearish order flow intact, a 15-minute MSS inside that zone is likely to fail. The higher timeframe has to support the reversal.
Look for the liquidity sweep first. A valid MSS is stronger when it follows a sweep of the lows before the break higher. The sweep clears out stop-loss orders and gives institutions a better average fill before driving price in the new direction.
Wait for the candle close. A wick above the lower high is not an MSS. The body of the candle needs to close above the level. A wick just tells you price visited that level briefly. A body close tells you buyers held it.
Watch the retest. After a real MSS, price should pull back to the flip zone and hold. If price immediately drops back through the flip zone and makes a new low, the shift was fake. Entering only on the retest gives you a natural filter. If the retest fails, you never entered.
Use your trading journal to track how often MSS entries that follow a liquidity sweep produce winners versus those that do not. Most traders find the sweep filter significantly improves their hit rate. Backtest both variations and compare.
How EdgeFlo Logs Shift-Based Entries
Knowing whether MSS or BOS entries work better for your strategy is not something you can guess. It requires data. And data requires consistent tagging.
EdgeFlo's trading journal supports entry reason tagging. After each trade, you tag the entry type: MSS, BOS, sweep-plus-flip, or whatever labels match your playbook. Over a sample of 50 or more trades per type, you see clear win rate and R-multiple differences.
If your MSS entries from the market structure shift playbook win at 45% with an average 3R, and your BOS entries win at 60% with an average 2R, both setups might be profitable, but you know which one suits your risk tolerance better. That is the kind of edge that comes from tagging, not guessing.
What is a market structure shift in trading?
What is a break of structure?
How do you tell a market structure shift from a break of structure?
What is a fake market structure shift?

Turn discipline on.
Every session.
EdgeFlo is the environment serious traders operate inside.
Start 7-Day Trial — $7
Cancel anytime.
No long-term commitment.


Think Different, Trade Different.