

Market Structure Shift vs BOS: Know the Diff
A market structure shift breaks against the trend. A BOS continues it. Learn the confirmation rules for each and stop confusing them.

A market structure shift (MSS) is a break of a swing point against the current trend direction. A break of structure (BOS) is a break with the trend. That is the entire difference. MSS signals a potential reversal. BOS signals continuation. Confusing the two costs real money because you end up trading a pullback as a reversal or a reversal as a continuation.
The confusion happens because both look the same on a chart at first glance, a swing point gets broken. The direction of the break relative to the existing trend determines which one it is, and that determination changes everything about your next trade.
TL;DR
BOS breaks a swing point in the trend direction (continuation signal).
MSS breaks a swing point against the trend direction (potential reversal signal).
Both require a body close at swing and internal levels. Fractal MSS uses wick breaks.
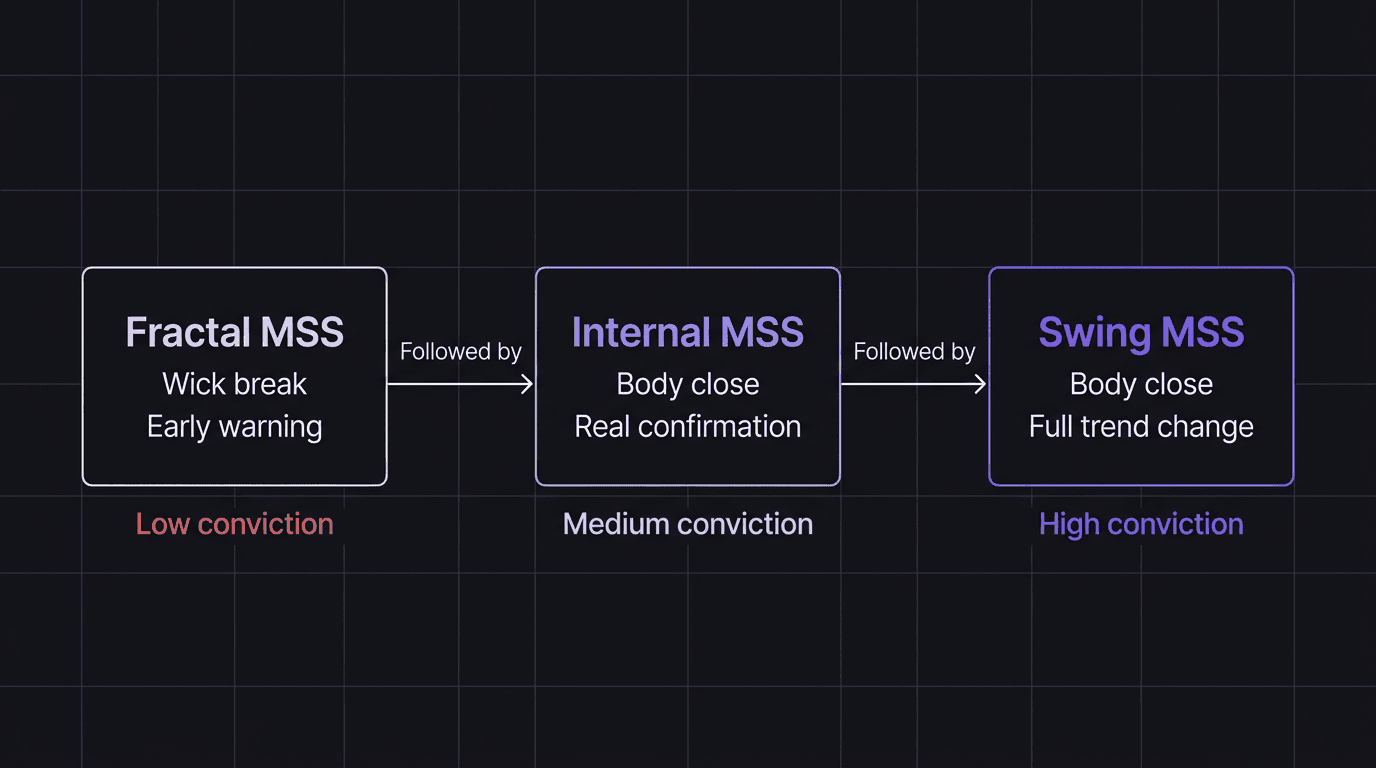
A fractal MSS is the earliest warning. An internal MSS is the first real confirmation. A swing MSS is a major event.
Never trade an MSS in isolation. Confirm it with your pre-trade checklist and higher timeframe context.
Market Shift vs Break of Structure
Picture a clean bullish market structure: higher highs and higher lows on the 1-hour chart. Price keeps making new highs. Each break above a previous swing high is a BOS. Trend continues.
Now something changes. Instead of making a new higher high, price fails. It rolls over and breaks below the most recent higher low with a body close. That is an MSS. The sequence of higher highs and higher lows is broken. The trend is no longer intact.
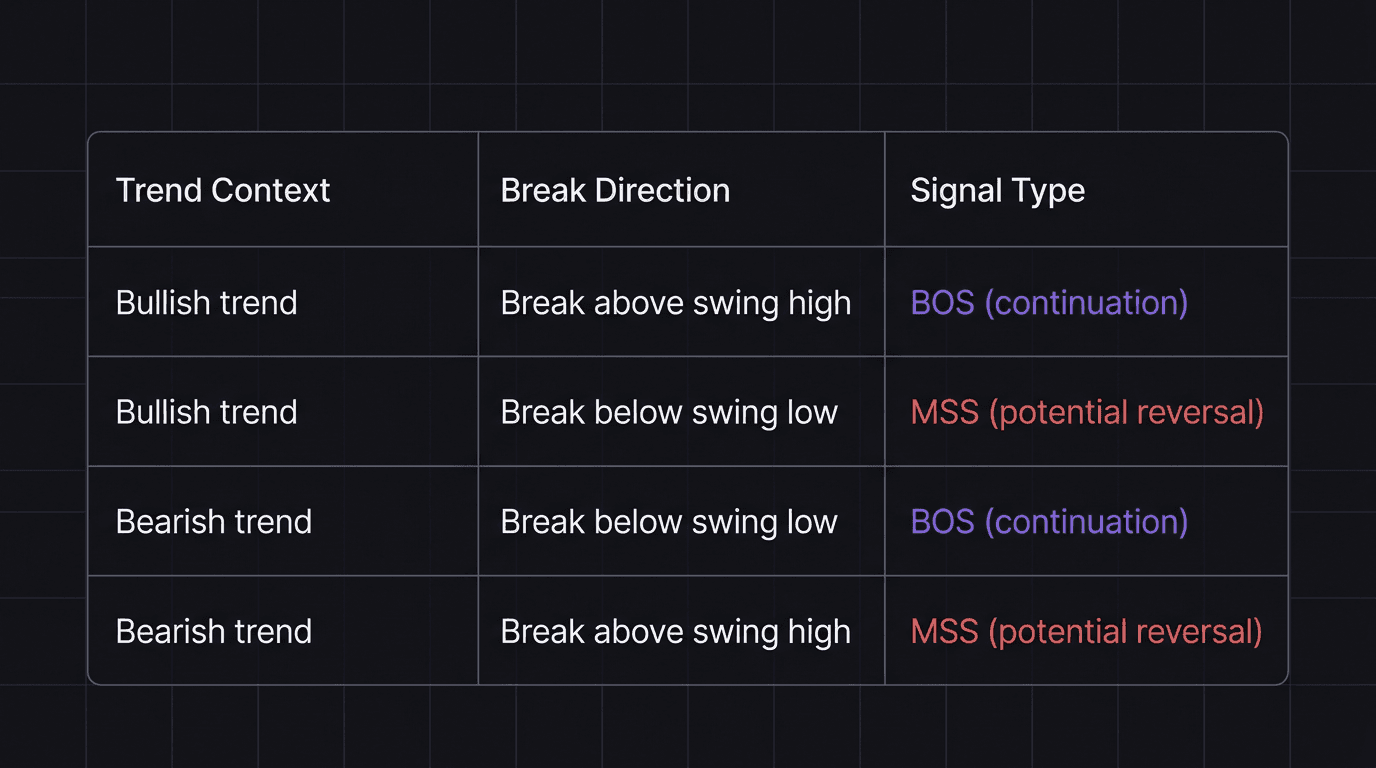
The directional context is what separates them:
Bullish trend + break above swing high = BOS (trend continues up)
Bullish trend + break below swing low = MSS (potential shift to bearish)
Bearish trend + break below swing low = BOS (trend continues down)
Bearish trend + break above swing high = MSS (potential shift to bullish)
Sound simple? It is. But under live market pressure, traders regularly misread one for the other. A fast move breaks a level and your instinct says "breakout." Whether that breakout is a BOS or MSS depends entirely on which direction the trend was moving before the break.
How a Market Structure Shift Forms
An MSS does not appear out of nowhere. It follows a recognizable sequence. Understanding the sequence keeps you from reacting too early or too late.
Phase 1: The trend is intact. Swing structure is clean. Higher highs and higher lows (bullish) or lower highs and lower lows (bearish). No ambiguity.
Phase 2: Momentum fades. Price attempts to make a new swing high (in a bullish trend) but the push is weaker. Maybe it barely exceeds the previous high. Maybe it fails to reach it entirely. This is not an MSS yet. It is the first clue that buyers are losing conviction.
Phase 3: The key swing point breaks. Price reverses and breaks below the most recent higher low with a body close. This is the MSS. The higher-low/higher-high sequence is now broken.
Phase 4: New structure begins forming. After the MSS, watch for a lower high to form. If price makes a lower high and then breaks below the MSS point again, you have the start of a new bearish trend. The MSS was the pivot between the two trends.
Not every MSS leads to a full reversal. Sometimes price breaks a swing low, forms a quick lower high, and then reverses back into the original trend. That is why you never trade an MSS blindly. You need follow-through.
Walkthrough: Bullish MSS on USD/JPY
USD/JPY has been in a downtrend on the 1-hour chart. Lower highs at 149.80, 149.50, 149.20. Lower lows at 148.60, 148.20, 147.80. Clean bearish structure.
Price drops to 147.80, bounces, and starts climbing. The most recent lower high is at 149.20. During the Tokyo session, a 1-hour candle closes its body at 149.28, above the 149.20 lower high.
That is a bullish MSS. The sequence of lower highs is broken. You now watch for a higher low to form. Price pulls back to 148.90 and holds. Then a new push breaks above 149.28.
You have a higher low (148.90) and a higher high (above 149.28). The trend has shifted. Traders who had their short bias documented in their mechanical trading plan now flip to neutral or bullish.
Walkthrough: False MSS Trap on AUD/USD
AUD/USD 1-hour chart. Bullish structure. Higher lows at 0.6520, 0.6560, 0.6590. Price pulls back and a candle closes its body at 0.6585, just below the 0.6590 higher low.
This looks like a bearish MSS. Some traders flip short. But the break was only 5 pips below the level, and the 4-hour chart still shows strong bullish swing structure. Price consolidates for two hours, then launches higher to 0.6650.
The MSS failed. Why? Because the higher timeframe context did not support it. A 1-hour MSS against a 4-hour bullish trend is often just a pullback, not a reversal. The 5-pip break was enough to technically qualify as an MSS but not enough to overcome the larger structural momentum.
Lesson: always cross-reference your MSS with the next higher timeframe before committing capital.
Confirmation Rules for a Valid MSS
The rules mirror BOS confirmation rules with one critical addition: directional context.
Rule 1: Body close required at swing and internal levels. A wick that pierces below a higher low does not count. You need the candlestick body to close beyond the level. No exceptions.
Rule 2: The broken level must be a strong swing point. A strong higher low is one that was followed by a new higher high. If the higher low was never confirmed by a subsequent higher high, it is not structurally significant. Breaking it is less meaningful.
Rule 3: The break must be against the current trend. This is what distinguishes MSS from BOS. If you are in a bullish trend and price breaks above a swing high, that is BOS (continuation). If it breaks below a swing low, that is MSS (potential reversal). Know your trend before reading the break.
Rule 4: Fractal MSS uses wick breaks. At the fractal (candle-by-candle) level, a wick break is sufficient for a fractal market shift. But remember, a fractal shift is an early warning, not a confirmation. It says "something might be changing." An internal MSS says "the change is real." A swing MSS says "the trend has changed."
The hierarchy matters. A fractal MSS is the first domino. If followed by an internal MSS, the signal strengthens. If the internal MSS is then followed by a swing MSS, you have a full trend change. But each level requires its own confirmation before you act on it.
Trading the Shift Without Guessing
The biggest mistake traders make with MSS is treating it as an instant entry signal. An MSS tells you direction might be changing. It does not give you a price to enter at.
Here is the systematic approach from a trading playbook:
After an MSS confirms: Mark the origin of the reversal move. This is typically the order block or demand zone where the MSS move started. Wait for price to pull back into this zone.
Example: Bullish MSS on the 1-hour breaks above 149.20. The move originated from a demand zone at 148.80-148.90. You do not chase price at 149.30. You wait for a pullback to the 148.80-148.90 zone and enter there with a tighter stop.
Align with higher timeframe. If the 4-hour is bearish and the 1-hour shows a bullish MSS, be cautious. You might be catching a pullback on the 4-hour, not a full reversal. The strongest MSS trades happen when the higher timeframe is either neutral or already shifting in the same direction.
Confirm with fractal structure. Once price reaches your entry zone, look for a fractal bullish shift on the 15-minute chart as your execution trigger. This gives you precision without guessing.
Set invalidation before you enter. Your invalidation sits below the most recent swing low (for a bullish MSS) or above the most recent swing high (for a bearish MSS). If price breaks through your invalidation level, the MSS has failed and you exit. No hoping, no averaging.
Backtesting this sequence across 50-100 trades gives you the confidence to trust the process. Without backtest data, every MSS feels uncertain. With data, you know exactly what your win rate and average R look like on confirmed MSS setups.
How EdgeFlo Keeps Your MSS Rules Consistent
Documenting MSS versus BOS rules is one thing. Applying them correctly at 8:30 AM when price is moving fast and your bias is pulling you in two directions is another. EdgeFlo's Edge feature puts your MSS confirmation checklist on screen during every session. Body close confirmed? Check. Higher timeframe aligned? Check. Entry zone reached? Check.
The journal captures your MSS trades separately so you can review them as a category. You can see how many MSS setups you took that aligned with your rules versus how many you forced without confirmation. That breakdown is where the real edge shows up.
Most traders know the MSS concept. Few execute it consistently because their rules live in their head instead of in a visible system. EdgeFlo moves the rules from memory to environment, where they are harder to skip.
The Edge Brief
Receive Insights on trading psychology, discipline, and the behavioral patterns that create consistent traders from our Founder and the EdgeFlo team, delivered to your inbox.
Think different. Trade different.
Is a market structure shift the same as a reversal?
Does an MSS require a body close or can a wick count?
What timeframe is best for identifying market structure shifts?
How do I avoid trading a false market structure shift?

Turn discipline on.
Every session.
EdgeFlo is the environment serious traders operate inside.
Start 7-Day Trial — $7
Cancel anytime.
No long-term commitment.


Think Different, Trade Different.