

Lower Timeframe Entry Model: When to Zoom In
Only drop to the 15-minute chart after price enters your zone on the higher timeframe. Zooming in too early causes premature entries. Here is the exact model.

The 15-minute chart is the most dangerous timeframe in trading. Not because it is unreliable, but because traders look at it at the wrong time.
Before price reaches your zone, the 15-minute chart is pure noise. Every candle looks like a reversal. Every wick looks like a rejection. Every consolidation looks like a breakout forming. You see patterns everywhere because the human brain is wired to find them, even when they mean nothing.
After price enters your zone, the same 15-minute chart becomes a precision tool. Now the micro-structure has context. Now the breaks and rejections happen at a level where institutional orders actually sit. The chart did not change. Your timing did.
TL;DR
Only drop to the 15-minute chart after price enters your point of interest on the 1-hour or 4-hour timeframe.
Looking at lower timeframes before your zone is reached causes premature entries and unnecessary stop-outs.
The entry model: wait for the last lower high (bullish) or last higher low (bearish) to break on the 15-minute.
This break confirms that the opposing side has lost control and your bias is taking over.
This single timing rule prevents most of the "stupid trades" that drain accounts.
When to Drop to the 15-Minute Chart
The rule is absolute. You open the 15-minute chart when, and only when, price has physically entered your point of interest.
Not when price is "close" to the zone. Not when price is "approaching." Not when the 4-hour candle has a long wick pointing toward your level. Only when a candle on the higher timeframe has traded into the zone boundary.
Before that moment, the 15-minute chart is off limits. Close it. Hide it behind another window. Set an alert at the zone and walk away. Every minute you spend watching the 15-minute before your zone is reached is a minute where your brain invents reasons to enter early.
This is not overcautious. This is structural. The 15-minute structure only becomes relevant when it is occurring inside a significant higher-timeframe level. A break of structure on the 15-minute at a random price is meaningless. A break of structure on the 15-minute inside a demand zone that sits in the discount of a 4-hour bullish swing range is a high-probability entry signal.
The Premature Entry Trap on Lower Timeframes
Here is what happens when you check the 15-minute too early.
EUR/USD is pulling back in a 4-hour bullish trend. Your demand zone is at 1.0880. Price is currently at 1.0920, 40 pips away. You open the 15-minute chart "just to check the structure."
You see a bullish engulfing candle at 1.0918. You see a break of a minor lower high. Your brain says: "That looks like my entry model." So you buy at 1.0920 with a stop at 1.0895.
Price drops to 1.0880 (your actual zone), sweeps below to 1.0872, and then rallies 110 pips. You were stopped out 25 pips above your zone because you took a 15-minute signal at an irrelevant price level.
The 15-minute gave you a "valid" break of structure. But valid at the wrong location is the same as invalid. The signal was real. The context was wrong. You lost money on a trade that would have been a winner if you had waited 3 hours.
Walkthrough: The Wrong Time to Zoom In
GBP/USD, 4H bearish. Supply zone at 1.2790 to 1.2810. Price is at 1.2760, climbing.
You open the 15-minute chart at 1.2760. You see bearish candles forming. You think: "Sellers are stepping in. I should short here before it gets to the zone."
You sell at 1.2762. Stop above the zone at 1.2815. Risk: 53 pips. Target at swing low 1.2680. Reward: 82 pips.
Price pushes through 1.2790, enters the supply zone, wicks to 1.2808, prints a pin bar with displacement, and drops 130 pips. Your entry was stopped out at 1.2815, exactly 7 pips above the zone high, because you entered 30 pips before the zone based on premature 15-minute analysis.
If you had waited for price to enter the zone and confirmed on the 15-minute at 1.2800, your stop at 1.2815 would be only 15 pips risk with 120 pips reward. R:R: 8:1 instead of getting stopped out.
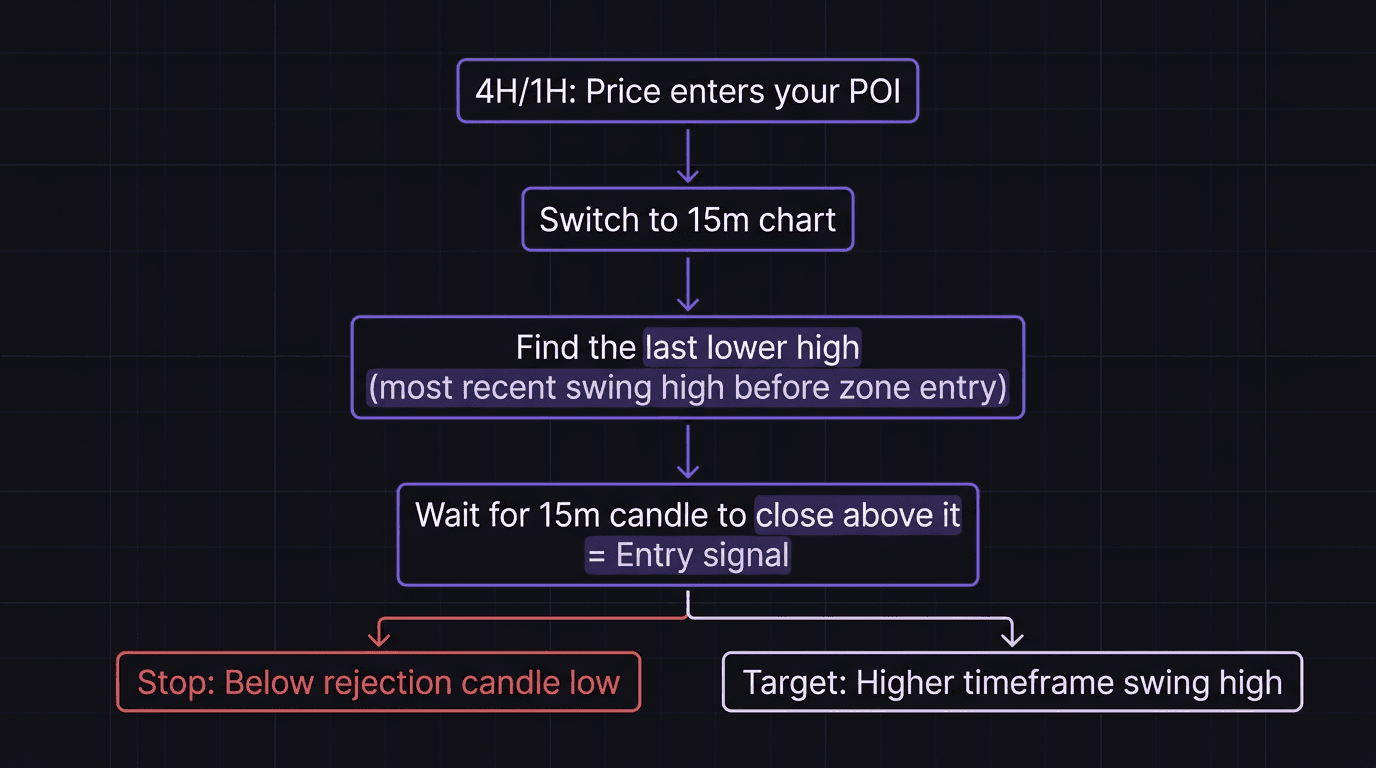
Breaking the Last Lower High as Confirmation
Once price is inside your demand zone, here is the specific confirmation model on the 15-minute chart.
During the pullback that brought price to your zone, the 15-minute was making lower highs and lower lows. That is normal; the selloff created bearish micro-structure. Your job is to wait for that micro-structure to break.
Identify the last lower high on the 15-minute. This is the most recent swing high before the final push into your zone. When a 15-minute candle closes above that lower high, the bearish micro-structure is broken. Buyers have demonstrated enough strength to flip the short-term trend.
For bearish setups (selling at supply zones), flip it: identify the last higher low on the 15-minute and wait for a candle to close below it.
This break is your entry signal. You buy on the close of that candle or place a limit order just above the broken lower high. Your stop goes below the rejection candle that formed inside the zone. Your target is the swing high on the higher timeframe.
Walkthrough: 4H Zone to 15m Entry
USD/JPY, 4H bullish trend. Demand zone at 149.20 to 149.45 in the discount of the swing range. Price pulls back from 150.80.
4H chart: Price enters the zone at 149.40. Alert fires. You open the 15-minute chart.
15m structure: The pullback created lower highs at 149.80, 149.65, and 149.50. The last lower high before the zone entry is at 149.50.
15m candle at 09:00: Price wicks to 149.18 (below the zone, liquidity sweep) and prints a bullish engulfing candle closing at 149.38. Rejection confirmed.
15m candle at 09:15: Another bullish candle closes at 149.42. Still below the last lower high at 149.50. Not yet.
15m candle at 09:30: Strong bullish candle closes at 149.55, above the last lower high at 149.50. Break confirmed. Entry signal.
Entry: 149.55. Stop below the rejection wick at 149.15. Risk: 40 pips. Target at the 4H swing high: 150.80. Reward: 125 pips. R:R = 3.13:1.
Price rallied to 150.80 over the next four days. The entry was clean because the 15-minute signal happened at the right location with confirmed higher-timeframe context.
How EdgeFlo Journals Your Timeframe Discipline
One of the hardest things to track manually is when you looked at the lower timeframe. Did you switch to the 15-minute before or after the zone was reached? Did you enter based on a valid signal at the right location, or did you jump the gun?
EdgeFlo's journal auto-imports your trade execution time. When you review the trade, you can see whether your entry timestamp aligns with when price actually entered the zone. If you entered 45 minutes before the zone was reached, that is a premature entry, and the journal makes it visible.
Over 20 trades, this timestamp data reveals your timing patterns. Maybe you always enter early during London open because the volatility feels urgent. Maybe you are disciplined in the afternoon but impulsive in the morning. The journal catches what your memory forgets.
When should I drop to the 15-minute chart for entry?
What is the lower timeframe entry confirmation?
Why does looking at the 15-minute chart too early cause losses?
Can I use the 5-minute chart instead of the 15-minute?

Turn discipline on.
Every session.
EdgeFlo is the environment serious traders operate inside.
Start 7-Day Trial — $7
Cancel anytime.
No long-term commitment.


Think Different, Trade Different.