

Institutional Entry Points: Where Smart Money Enters
Institutional entry points are where smart money fills large orders using swept liquidity. Identify demand and supply zones that institutions actually use.

Every supply and demand zone on your chart is not equal. Some zones hold price for 50 pips. Others get sliced through without a reaction. The difference is whether institutions are actually filling orders at that level. Institutional entry points are the zones where smart money steps in after sweeping liquidity, and learning to identify them changes how you select trades.
TL;DR
Institutional entry points are specific supply and demand zones where smart money fills large orders.
Not all zones qualify. The ones that matter caused a break of structure and sit near a liquidity pool.
Institutions sweep liquidity first, then enter at their zone. The sweep is the fuel; the zone is the location.
Qualifying a zone before the session starts is what separates planned trades from hope trades.
Combining zone selection with timing and confirmation turns a vague "supply and demand" approach into a repeatable system.
Why Most Supply and Demand Zones Fail
If you have traded supply and demand for any length of time, you know the frustration. You mark a zone, price reaches it, and nothing happens. Price blows through your zone like it was never there. Your stop gets hit, and you wonder whether supply and demand trading even works.
It does work. But only at the right zones. And "right" has a specific definition.
The core problem is that retail traders mark every consolidation, every pause, and every candle cluster as a zone. They end up with 15 zones on a chart and no way to prioritize. When price reaches zone number 7, they enter because "it's a supply zone." But the zone had no institutional significance. It was just a pause in price, not a place where smart money built positions.
Institutional entry points are different. They have structural evidence that large orders were placed there, and they have a logical reason for smart money to return to that price.
What Makes a Zone Institutional
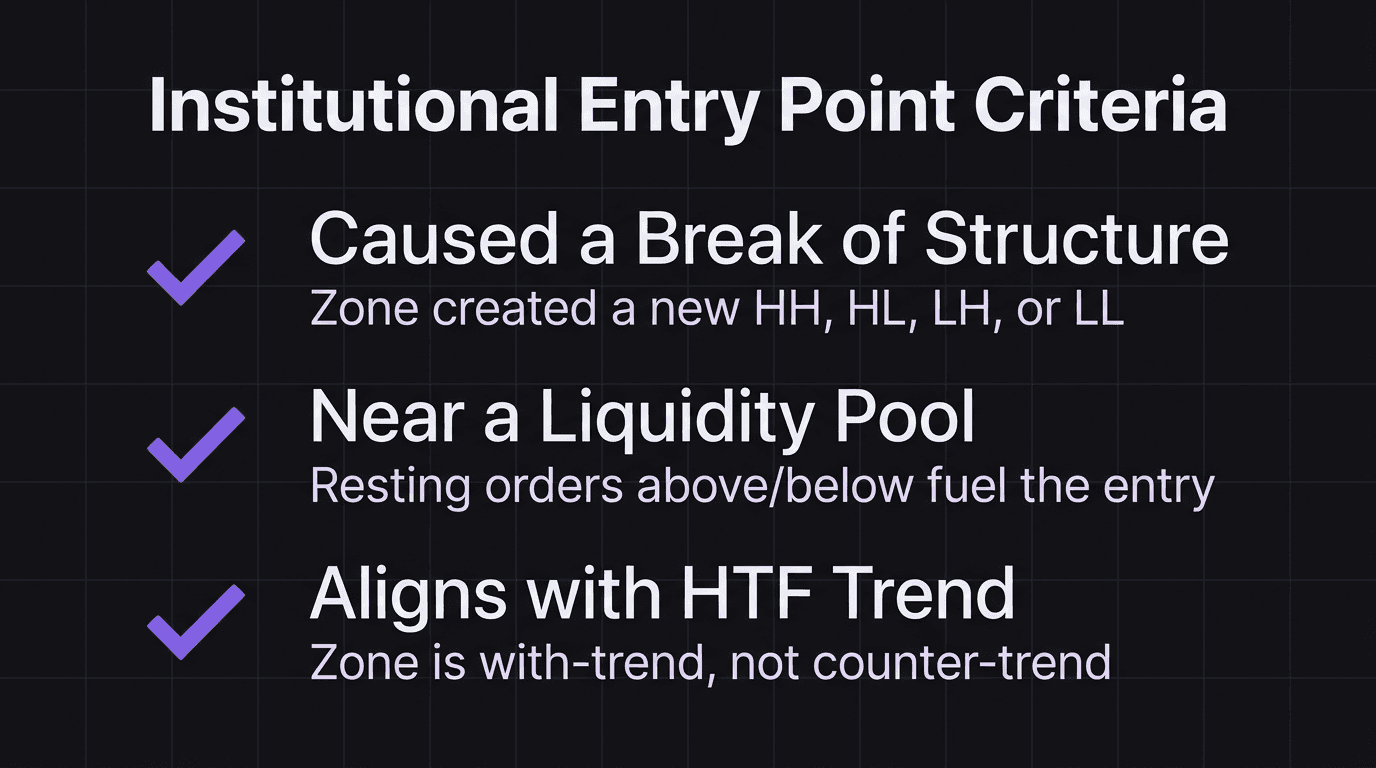
Three criteria separate an institutional entry point from a generic zone:
1. It Caused a Break of Structure
The strongest zones are the ones that created a structural shift. If price was making higher lows and then a supply zone caused a lower low, that supply zone is where institutions placed sell orders large enough to change the trend. That is structural evidence of institutional involvement.
Compare this to a random pause in an uptrend. Price consolidates for three candles, then continues up. That consolidation might be a "demand zone" on your chart, but nothing structural happened there. No break of structure, no trend change, no evidence of large orders.
When you mark zones, ask: "Did price break structure after leaving this zone?" If yes, it qualifies. If no, skip it.
2. It Sits Near a Liquidity Pool
Institutions do not enter at random prices. They enter where liquidity exists to fill their orders. A zone that sits near a cluster of resting orders (above swing highs for supply zones, below swing lows for demand zones) has a higher probability of being revisited because the sweep-and-enter sequence works in their favor.
If a demand zone sits just below a series of equal lows, institutions can sweep those lows (grabbing sell-side liquidity) and fill buy orders at the demand zone in the same move. The zone and the liquidity pool work together.
3. It Aligns with the Higher-Timeframe Trend
An institutional demand zone in a daily uptrend has a much higher probability of holding than a demand zone in a daily downtrend. Institutions are not fighting the trend. They are using lower-timeframe pullbacks to enter in the trend direction at a better price.
If the daily chart shows bearish structure, the supply zones on the 15-minute chart are your priority. The demand zones on the 15-minute are counter-trend and have lower probability. You might still see reactions at those demand zones, but they are likely to produce short-lived bounces rather than trend continuation.
The Extreme Zone: Highest Priority
Among qualified zones, one stands above the rest: the extreme zone. This is the very last zone that caused the most recent higher-timeframe break of structure. It represents the last line of defense for the current trend.
In a bearish trend, the extreme supply zone is the highest zone that created the most recent lower high. If price retraces all the way up to that zone, it is the final test. If the zone holds and price reverses, the bearish trend continues. If price breaks above the zone, the trend may be shifting bullish.
This makes the extreme zone the highest-priority institutional entry point because:
It has the strongest structural significance (it literally created the trend).
Institutions have the most motivation to defend it (they have positions built from that price).
It typically sits near the deepest liquidity pool (all the internal swing highs below it have been swept by the time price reaches the extreme).
When you can only trade one zone, trade the extreme.
Walkthrough: Identifying and Trading an Institutional Demand Zone
USD/JPY on the 15-minute chart. The 4-hour shows a clear bullish trend: higher highs and higher lows. The most recent break of structure to the upside happened when price pushed above 151.80.
You identify the demand zone that caused that break: a cluster of candles between 151.40 and 151.55. This is where buying pressure was strong enough to break above the previous swing high at 151.80.
Below the demand zone, you mark sell-side liquidity at 151.35 (a swing low) and 151.20 (equal lows from a previous consolidation).
You write in your trading plan: "Bullish bias. Looking for longs at the 151.40 to 151.55 demand zone. Price needs to sweep sell-side liquidity below 151.35 or 151.20 first. Enter on V-shaped reaction and bullish break of internal structure. Stop below 151.15. Target: 152.20 (previous swing high)."
London opens. Price drops during the first 15 minutes, sweeping the sell-side liquidity at 151.35 and reaching 151.42 (inside the demand zone). A V-shaped reaction candle prints: a large bullish candle with a long lower wick. Internal structure breaks bullish as price pushes above 151.60.
You enter long at 151.62. Stop at 151.30 (below the demand zone and the swept low). Target: 152.20.
Risk: 32 pips. Reward: 58 pips. That is 1.81R.
Math check: On USD/JPY at approximately $6.60/pip per standard lot (with USD/JPY around 151.50, 1 pip = approximately 0.0066 USD per unit, so 1 standard lot = $6.60/pip). To risk $100 (1% of $10,000), you need: $100 / (32 pips times $6.60) = $100 / $211.20. That is about 0.47 lots. With 0.47 lots: risk = 32 times $6.60 times 0.47 = $99.26. Reward = 58 times $6.60 times 0.47 = $179.92. R:R = 1.81. Confirmed.
The demand zone held because it had all three criteria: it caused a break of structure, it sat above a liquidity pool that got swept, and it aligned with the 4-hour bullish trend.
Walkthrough: Why Generic Zones Fail
Same pair, same day. A different trader marks a "demand zone" at 151.90 to 152.00 because price paused there for an hour on the way up. It looks clean. The candles are small. It seems like a valid zone.
Price drops through 151.90 without pausing. The trader's buy order fills at 151.95 with a stop at 151.80 (15 pips). Price continues dropping to 151.42 before bouncing.
The trader gets stopped out for a 15-pip loss. Their zone had no structural significance. It did not cause a break of structure. It was just a minor pause, not an institutional position-building zone.
If the trader had applied the three criteria (break of structure, liquidity pool proximity, trend alignment), they would have skipped the 151.90 zone and waited for the 151.40 zone. The difference between a 15-pip loss and a 58-pip gain came down to zone selection.
Grading Your Zones Before the Session
Use this pre-trade checklist for zone grading during your pre-session markup:
Did the zone cause a break of structure? Mark the structural shift it created. If you cannot point to a specific break, the zone does not qualify.
Is there a liquidity pool near the zone? Identify the resting orders (above swing highs for supply, below swing lows for demand) that sit between current price and the zone. The sweep of that pool is your first confirmation.
Does the zone align with the higher-timeframe trend? Check the 4-hour or daily. If the zone is counter-trend, downgrade its priority.
Is it the extreme zone? If yes, it is your highest-priority entry. If there are multiple qualifying zones, rank the extreme zone first and the internal zones second.
Can you define your stop, entry, and target? If the zone is too wide or the stop placement is unclear, the zone is not actionable for your risk parameters.
Zones that pass all five checks go on your active list. Everything else gets ignored. This filter dramatically reduces the number of trades you take, but the trades you do take have structural backing and institutional logic behind them.
The Patience Required
The hardest part of trading institutional entry points is that price might not reach your zone for hours. Or days. Or at all.
You mark the extreme supply zone at 1.0950. Price pushes up to 1.0930, stalls, and drops. Your zone never got tested. You did not enter. And that feels like a missed opportunity.
It is not. The zone was not reached, which means the institutional criteria were not met. Entering at 1.0930 "because it was close" would have been a guess, not a plan. And guesses are what produce the inconsistency that kills accounts.
Your trading edge comes from the selectivity. Every zone you skip because it did not meet criteria is a potential loss avoided. Over 50 or 100 trades, the zones you did not trade contribute to your profitability just as much as the zones you did.
You can backtest this. Go back through three months of charts, mark zones using the three criteria, and track which ones produced reactions versus which ones failed. The hit rate on qualified zones versus unqualified zones will make the case for you.
How EdgeFlo Supports Zone-Based Trading
EdgeFlo's Edge feature (the trade plan builder) gives you a place to document your zone criteria before the session. Write your zone grade, your entry conditions, your stop, and your target. The plan sits next to your chart during execution, so you do not have to remember your analysis from two hours ago.
After the trade, EdgeFlo's self-reporting feature asks whether you followed the plan. Did you enter at the zone you marked? Did you wait for the sweep? Did you confirm structure? Over time, this builds a record that shows you which parts of your process produce results and which parts you tend to skip.
The plan is not enforced in real time (you can deviate if you choose). But the post-trade accountability creates a feedback loop that tightens your execution batch by batch. That loop is where discipline compounds into consistency.
The Edge Brief
Receive Insights on trading psychology, discipline, and the behavioral patterns that create consistent traders from our Founder and the EdgeFlo team, delivered to your inbox.
Think different. Trade different.
What is an institutional entry point?
How do you identify institutional entry points?
Why do institutional entries happen after liquidity sweeps?
Can retail traders trade at institutional entry points?

Turn discipline on.
Every session.
EdgeFlo is the environment serious traders operate inside.
Start 7-Day Trial — $7
Cancel anytime.
No long-term commitment.


Think Different, Trade Different.