

Institutional Demand Zones After Liquidity Sweeps
The best demand zones form right after liquidity sweeps when institutions have filled orders. Learn how to mark, enter, and manage trades from post-sweep demand zones.

Not all demand zones are created equal. Some are textbook markings that look good on a chart but fail the moment price returns to them. Others hold with surgical precision, bouncing price exactly where you expected.
The difference is not how you draw the zone. It is what happened before the zone formed. The best demand zones in the market appear right after a liquidity sweep, when institutions have used the collected stop orders to fill their real positions. Those zones have unfilled orders. Regular zones are just lines on a chart.
TL;DR
The best demand zones form immediately after liquidity sweeps.
Sweeps provide the liquidity institutions need to fill large buy orders at those zones.
Post-sweep zones carry unfilled institutional orders, making retests more reliable.
Draw the zone from the body of the candle that swept and reversed.
Use structure shifts on lower timeframes to confirm your entry timing.
What Makes a Demand Zone Institutional Grade
A standard supply and demand zone is any area where price moved sharply away from a level. But "sharp move" alone does not tell you who was buying. It could be retail FOMO. It could be algorithmic rebalancing. It could be random.
An institutional demand zone has a specific signature: it forms at a price point where institutions actually entered buy orders. And the most reliable way to identify that is by checking whether a liquidity sweep preceded the zone.
Here is the logic. Institutions cannot fill a 500-lot buy order at one price without moving the market against themselves. They need someone selling at that price in volume. A liquidity sweep provides exactly that. When price dips below equal lows or a key support level, it triggers stop losses from long-positioned traders. Those stop losses are sell orders. The institution absorbs those sell orders with their buy orders, getting filled at a discount without pushing price up.
The zone that forms at that sweep point is where the institutional buying actually happened. When price returns to it later, any remaining unfilled orders from the same institutions act as a floor.
Signs of an institutional demand zone:
A sweep precedes the zone. Price took out a visible liquidity level (equal lows, range support, prior swing low) before creating the zone.
Strong displacement away from the zone. After the sweep, price moved sharply upward, indicating large buy orders were filled.
A structure shift followed. On a lower timeframe, bearish structure broke bullish after the sweep.
The zone is in a discount area. Relative to the higher timeframe swing, the zone sits below the 50% equilibrium.
Why Sweeps Create the Best Entry Zones
Think about what a sweep does from an order flow perspective. Before the sweep, stop losses are sitting below a visible level. Those are pending sell orders. When price dips through the level and triggers those stops, a burst of selling hits the market.
Institutions buy into that selling burst. They get filled at the best possible price because there is no competition from other buyers at that moment. Everyone else is panicking.
The candle that sweeps and reverses is the footprint of that institutional buying. The zone it creates is not theoretical. It is the actual price range where large buy orders were filled.
When price returns to that zone later, two things support a bounce:
Unfilled orders. Institutions rarely fill their entire position in one sweep. Remaining limit orders sit at the zone, waiting for price to return.
Defense. Institutions protect their entry price. If price returns to where they bought, they have reason to buy more to prevent their position from going into a loss.
This is why post-sweep demand zones have higher hold rates than generic zones. The buying interest is not speculative. It is structural.
How to Mark Post-Sweep Demand on Your Chart
Marking the zone correctly is important. Too wide and your entry is sloppy. Too narrow and you miss it.
Here is the method:
Identify the liquidity sweep. Price must have taken out a visible level (equal lows, swing low, range support).
Find the sweep candle. This is the candle that dipped below the level and then closed above it (or the candle that initiated the sharp reversal).
Draw the zone from the candle body open to the candle wick low. The body is where institutional buying concentrated. The wick low is the deepest point of the sweep.
For a cleaner zone, use only the body of the sweep candle as your primary zone and the wick as your extended zone (where aggressive entries live).
Walkthrough: Post-Sweep Demand Zone on EUR/USD
EUR/USD 1-hour chart. Price is in an uptrend. A pullback forms equal lows at 1.0840. Price dips to 1.0825, sweeping the lows. The sweep candle opens at 1.0845, dips to 1.0825, and closes at 1.0850. This candle is your sweep candle. Draw the demand zone from 1.0845 (body open) to 1.0825 (wick low).
Price rallies to 1.0920 after the sweep. Two days later, price pulls back to 1.0842, entering the demand zone. A trader enters long at 1.0842 with a stop at 1.0820 (22-pip risk below the zone, $220 per standard lot at $10/pip). Price bounces and reaches 1.0920 again, a 78-pip move. Reward: $780. R:R is 3.55.
The zone held because institutional buy orders from the original sweep were still sitting there, waiting to be filled on the retest.
Entry and Stop Placement for Sweep-Based Zones
Two entry methods work for post-sweep demand zones:
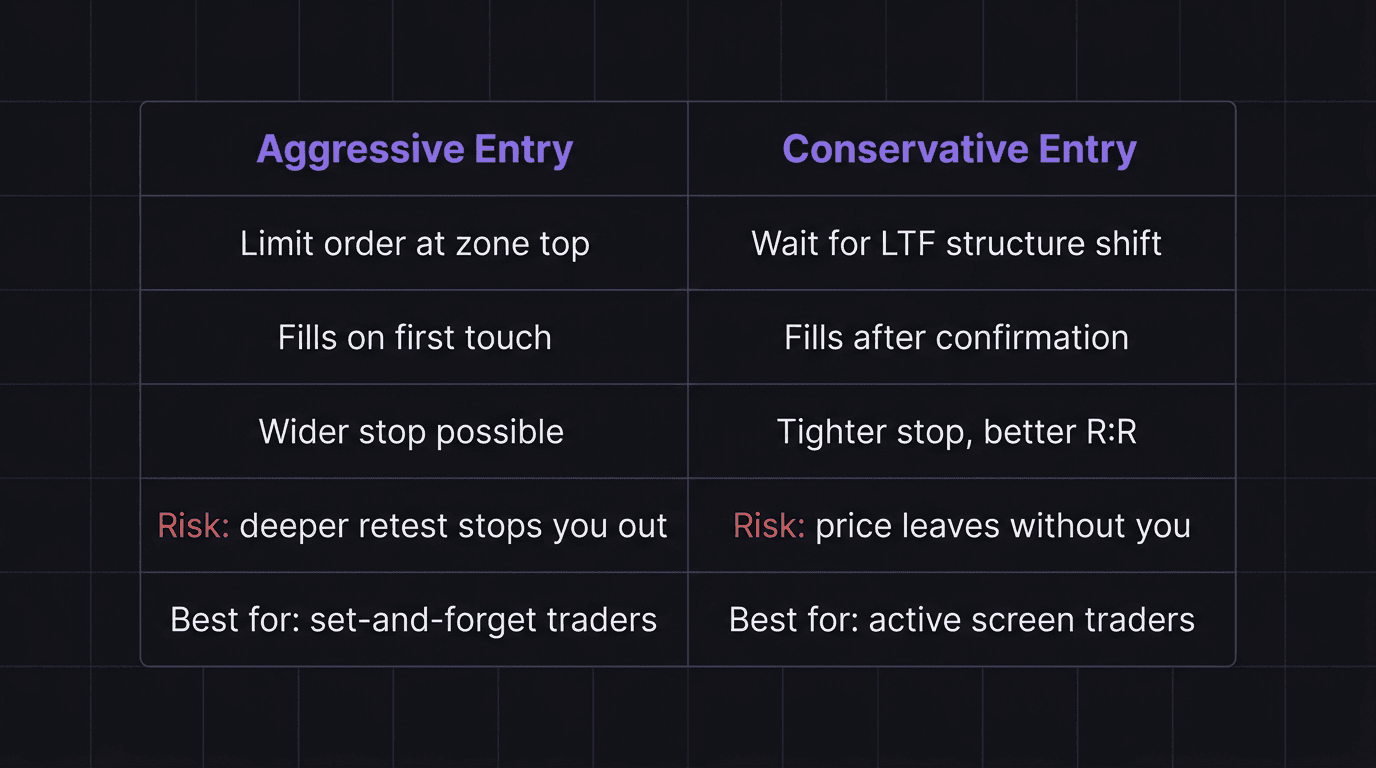
Aggressive entry: Place a limit order at the top of the demand zone (the body open of the sweep candle). Your stop goes below the wick low of the sweep candle, plus a small buffer. This gets you in early with maximum reward potential, but you risk getting stopped if price sweeps slightly deeper on the retest.
Conservative entry: Wait for price to enter the zone, then drop to a lower timeframe (5-minute or 1-minute). Look for a break of structure shift from bearish to bullish within the zone. Enter after the shift with a stop below the sweep wick. This confirms that buying pressure is present before you commit.
For position sizing, measure the distance from your entry to your stop. That is your risk per trade. Size accordingly based on your account risk percentage.
Walkthrough: Aggressive vs Conservative Entry on GBP/USD
GBP/USD forms a post-sweep demand zone between 1.2680 (body open) and 1.2660 (wick low) after sweeping equal lows at 1.2670.
Aggressive trader: Limit buy at 1.2680. Stop at 1.2655 (25-pip risk, $250 per standard lot). Price touches 1.2678, fills the order, and rallies to 1.2760, an 80-pip move. Reward: $800. R:R is 3.2.
Conservative trader: Waits for price to enter the zone. At 1.2672, drops to the 5-minute chart. Sees structure shift bullish at 1.2678. Enters long at 1.2678 with a stop at 1.2655 (23-pip risk, $230). Price rallies to 1.2760, an 82-pip move. Reward: $820. R:R is 3.57.
Both entries work. The aggressive entry is slightly simpler but carries more risk of getting caught in a deeper retest. The conservative entry requires more screen time but offers better confirmation.
How EdgeFlo Highlights Post-Sweep Zones
Spotting post-sweep demand zones requires you to track liquidity levels, identify sweeps, and mark zones in real time. That is a lot of cognitive load during a live session.
EdgeFlo's FloAI (Plus plan) surfaces observations about pattern formations and structural changes as they develop. When a sweep occurs near a zone you are watching, it can flag the event so you do not miss the setup while managing other positions.
The auto risk calculator also helps with execution. Once you identify a post-sweep zone and know your entry and stop levels, the calculator sizes your position based on your account risk rules. No mental math, no spreadsheet tab-switching during a fast market.
After the trade, the journal captures everything automatically. Tag your post-sweep zone trades and compare their stats against your regular zone trades over time. The data typically shows a clear edge for zones that formed after a confirmed liquidity sweep. That data turns a concept into conviction.
What makes a demand zone institutional grade?
Why are post-sweep demand zones stronger than regular ones?
How do you draw a demand zone after a sweep?
Should I enter on the first retest of a post-sweep zone?

Turn discipline on.
Every session.
EdgeFlo is the environment serious traders operate inside.
Start 7-Day Trial — $7
Cancel anytime.
No long-term commitment.


Think Different, Trade Different.