

The 100-Trade Rule: Why You Need a Real Sample Size
Why 10 or 20 trades proves nothing about your trading strategy. Learn why 100 trades is the minimum sample size and what to track across them.

You cannot know if your trading strategy works after 10 trades. Or 20. Or even 50. Variance is too high in small samples. A 40% win rate strategy can easily produce 7 wins out of 10 on a lucky run, and a 60% win rate strategy can produce 4 wins out of 10 on a bad stretch. Small samples lie.
One hundred trades is the minimum sample size that gives your real edge a chance to show itself. Below that number, you are reacting to noise, not signal.
TL;DR
Ten or twenty trades is not enough data to judge any strategy. Variance dominates small samples.
At 100 trades, your win rate, average R, and expectancy start to reflect your actual edge.
Track win rate, average winner, average loser, expectancy, and maximum drawdown across the full sample.
Do not change your strategy mid-sample. Finish the 100 trades, read the data, then adjust.
Losing streaks inside the sample are normal. They are not a signal to abandon your plan.
Why 10 Trades Proves Nothing
Imagine flipping a fair coin 10 times. You could easily get 7 heads and 3 tails. Does that mean the coin is biased? No. The sample is too small. Flip it 1,000 times and you will land close to 50/50.
Trading works the same way. A strategy with a genuine 45% win rate and a 2.5R average winner is profitable over hundreds of trades. But in any stretch of 10, it might win 2 and lose 8. If you judged it after those 10 trades, you would throw it away.
This is exactly what most traders do. They test a plan for two weeks, hit a rough patch, and switch to something new. Then they test that one for two weeks, hit another rough patch, and switch again. The pattern repeats indefinitely.
The strategy was never the problem. The sample size was.
Walkthrough: Same Strategy, Two Different 10-Trade Runs
Your strategy has a 45% win rate and averages +2.5R on winners and -1R on losers.
Run 1 (first 10 trades): 7 losses, 3 wins. Total: (7 times -1R) + (3 times 2.5R) = -7R + 7.5R = +0.5R. Barely positive. Feels terrible.
Run 2 (next 10 trades): 3 losses, 7 wins. Total: (3 times -1R) + (7 times 2.5R) = -3R + 17.5R = +14.5R. Feels amazing.
Same strategy. Wildly different results. That is variance. Only the combined 20-trade view (+15R total) starts to look like the strategy's real performance, and even 20 is not enough.
The Math Behind 100 Trades
At 100 trades, the math starts to settle. Variance does not disappear, but it shrinks enough that your underlying edge becomes visible.
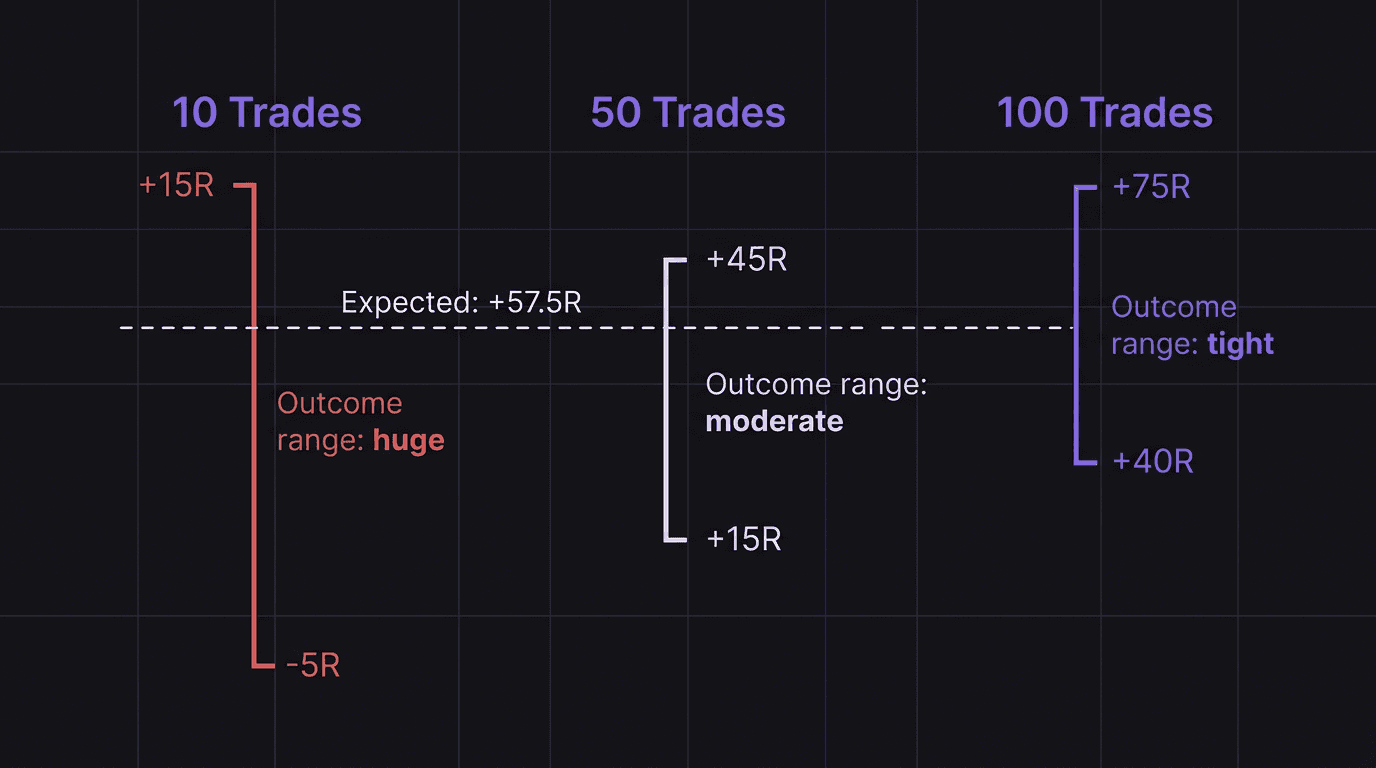
Here is why 100 is the number. With a 45% win rate strategy, after 100 trades you expect approximately 45 wins and 55 losses. The actual numbers might be 42 wins or 48 wins, but they are unlikely to be 25 wins or 70 wins. The range of possible outcomes narrows.
Expectancy is the metric that tells the truth. The formula: (win rate times average win) minus (loss rate times average loss).
For the strategy above: (0.45 times 2.5R) minus (0.55 times 1R) = 1.125R minus 0.55R = +0.575R per trade.
Over 100 trades, that is +57.5R of expected profit. Even if variance shifts the actual result to +40R or +75R, both outcomes clearly show the strategy works. That clarity is impossible at 10 trades.
What to Track Across Your Sample
Collecting 100 trades is useless if you only track "win" and "loss." Here is what to record for every trade in the sample:
Win rate. Total wins divided by total trades. Track this as a running number that updates after each trade.
Average winner (in R). Sum of all winning R-values divided by number of wins. If your plan targets 2R but your average winner is 1.3R, you are either taking profits too early or your targets are unrealistic.
Average loser (in R). Should be close to -1R if you are placing stops correctly. If it is -1.5R or worse, you are moving stops, widening them, or not exiting when you should.
Expectancy. (Win rate times average winner) minus (loss rate times average loss). Positive expectancy means your strategy makes money over time. Negative expectancy means it loses money, regardless of how good individual trades feel.
Maximum drawdown. The worst peak-to-trough decline in your equity curve during the sample. This tells you how bad the bad stretches get. If your max drawdown is 15R and your total return is 50R, you know the ride will be bumpy.
Consecutive losses. The longest losing streak in the sample. If your strategy produces streaks of 8 losses in a row, you need to know that before you risk real money. If you cannot stomach 8 losses in a row, either reduce your risk per trade or find a strategy with a higher win rate.
Walkthrough: Reading a 100-Trade Sample
After 100 forward-tested trades on EUR/USD, you have the following data:
Wins: 43. Losses: 57. Win rate: 43 divided by 100 = 43%. Average winner: +2.3R. Average loser: -1.0R. Expectancy: (0.43 times 2.3) minus (0.57 times 1.0) = 0.989 minus 0.57 = +0.419R per trade. Total R over 100 trades: +41.9R. Maximum drawdown: -12R (occurred between trades 34 and 52). Longest losing streak: 7 trades in a row.
What does this tell you? Your strategy has a positive expectancy. The max drawdown of 12R is manageable if you risk 0.5% per trade (that is a 6% account drawdown). The 7-trade losing streak is something you need to prepare for emotionally and financially.
This is real data. This is proof your edge exists. You cannot get this from 10 trades.
How to Handle Losing Streaks Inside the Sample
You will hit losing streaks during your 100-trade sample. This is guaranteed if your win rate is below 60%. The question is not whether they happen, but what you do when they arrive.
The answer: nothing. Do not change your plan during the sample.
If you modify your entry after trade 30 because you lost 5 in a row, you have contaminated your data. You are now testing two different strategies in the same sample, and neither has enough data to be valid. Start over or accept that the data is mixed.
The whole point of the 100-trade rule is to let variance play out. Losing streaks are part of the distribution. They feel terrible, but they are not evidence that the strategy is broken. Only the full 100-trade sample gives you that evidence.
Here is a rule that helps: before starting the sample, write down the worst-case scenario you are willing to accept. "I will complete 100 trades even if I hit 10 consecutive losses and a 20R drawdown." If the sample breaches that threshold, stop and reassess. Otherwise, keep going.
After the sample is complete, you can make changes. Not during.
Backtesting helps you set realistic expectations for drawdown before you start the forward test. If your backtest shows a maximum losing streak of 6, prepare for 8 to 10 in live conditions. Real-time execution adds variance that historical data misses.
How EdgeFlo Calculates Your Edge Over Sample Size
EdgeFlo's dashboard calculates rolling statistics across your trade sample automatically. As you log trades in your journal, the dashboard updates your win rate, average R, expectancy, and drawdown in real time. You do not need a spreadsheet.
The dashboard shows your equity curve building trade by trade. After 50 trades, you can see whether the curve is trending up, flat, or down. After 100, the pattern is clear.
You can also filter the data by variable: entry type, session, pair, or any custom tag. This lets you run sub-samples within the larger sample. "What is my expectancy on London session trades only?" or "What is my win rate when I enter at the equilibrium versus the edge?" These filters turn raw data into actionable decisions about what to keep and what to cut from your plan.
Why is 100 trades the minimum sample size?
Can I count backtested trades toward my 100-trade sample?
What if my strategy only produces 2 trades per week?
Should I reset my sample if I change one variable in my plan?

Turn discipline on.
Every session.
EdgeFlo is the environment serious traders operate inside.
Start 7-Day Trial — $7
Cancel anytime.
No long-term commitment.


Think Different, Trade Different.