

Variance in Trading: Why Short-Term Results Lie
A winning week does not prove your edge works. A losing week does not prove it is broken. Learn how variance distorts short-term results and what to measure instead.

Variance in trading is the gap between what your edge should produce over time and what actually shows up on any given week. A strategy with a genuine 55% win rate can easily lose six out of ten trades in a short stretch, not because the strategy broke, but because ten trades is nowhere near enough data to reveal the real number. Short-term results lie. The law of large numbers needs volume before it smooths the noise into signal.
If you have ever abandoned a profitable setup after a rough week, or doubled your risk after a hot streak, variance already cost you money. And it will keep doing it until you learn to measure what matters.
TL;DR
Variance is the random scatter around your true edge. It shrinks as your sample size grows, not before.
A winning week does not confirm your system works. A losing week does not confirm it is broken.
The law of large numbers requires roughly 100 or more trades before results reliably reflect your actual expectancy.
Tracking expectancy over months, not days, is the only way to separate signal from statistical noise.
Reacting to short-term results (changing rules, sizing up, quitting) is the single fastest way to destroy a working edge.
What Variance Actually Means for Traders
Think about a roulette wheel. The casino's edge on a single color bet is about 5.26% (20 winning slots out of 38 total, for a 52.63% house advantage). On any single spin, the house could lose. On ten spins, the house could be down. But across 1,000 spins at $1,000 each? The math converges. The casino nets roughly $52,630 on those spins because variance compresses with volume.
Your trading works the same way. You have a strategy with a positive edge (if you have tested it properly). On any single trade, the outcome is random within the parameters of that edge. On ten trades, the outcome is still mostly noise. On 200 trades, the real numbers start emerging.
The problem? Most traders judge their system on 10 to 20 trades. That is like judging a roulette wheel after eight spins and concluding it is rigged against the house.
Why 10 Trades Tell You Nothing
Here is a concrete scenario. You have a strategy that wins 50% of the time with a 2.5:1 reward-to-risk ratio. Over a large sample, that is a strong edge. But over 10 trades, perfectly normal variance can produce any of these outcomes:
7 wins, 3 losses (looks incredible, tempts you to size up)
3 wins, 7 losses (looks broken, tempts you to change your rules)
5 wins, 5 losses (looks mediocre, tempts you to search for a "better" setup)
All three outcomes came from the exact same strategy. The only thing that changed was which trades happened to cluster together in that small window.
Sound familiar? You had a good week, added size, then gave back two weeks of profit. Or you had a bad week, swapped to a new indicator, and missed the recovery that your original plan would have caught.
That is variance taxing you for reacting too early.
The Law of Large Numbers in Practice
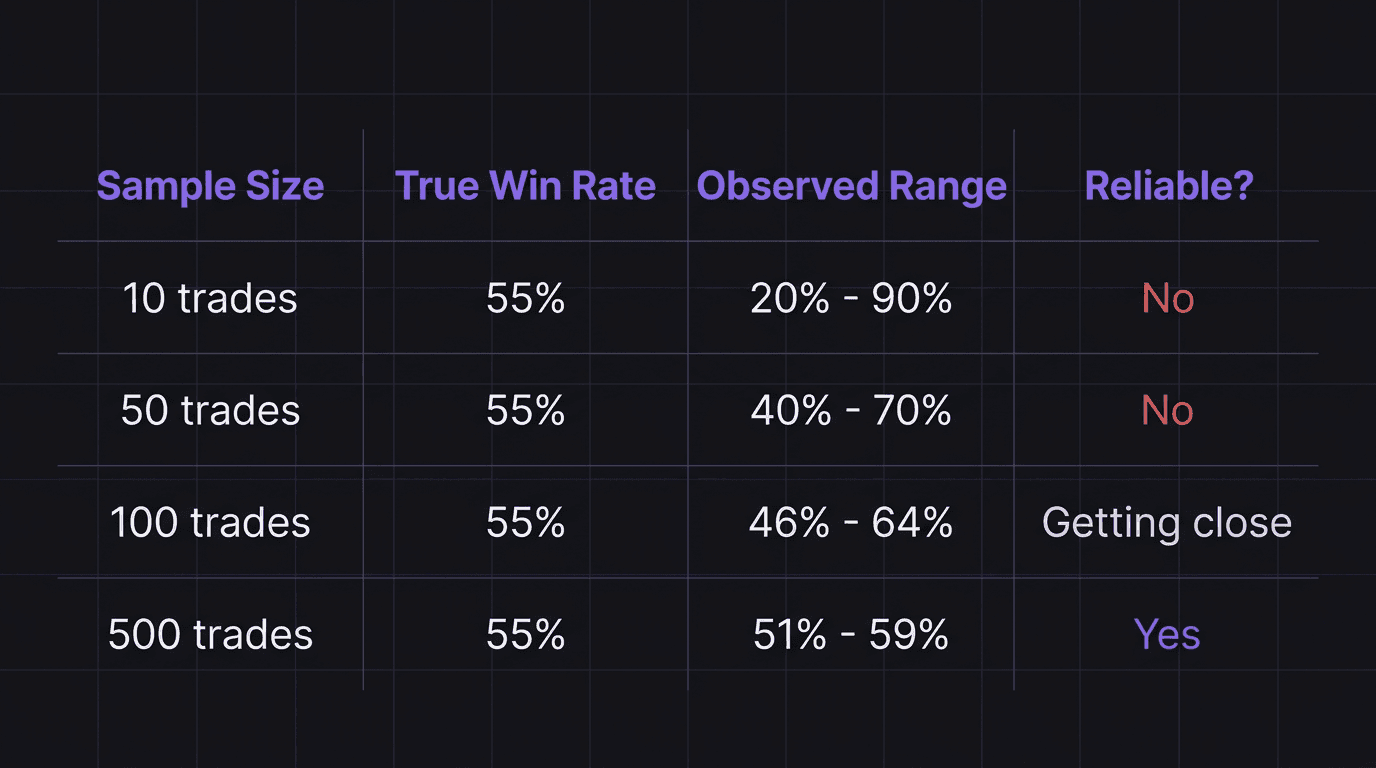
The law of large numbers says that as your sample grows, your observed results converge toward your true expectancy. A 55% win rate strategy might show anywhere from 35% to 75% over 20 trades. Over 200 trades, the range tightens dramatically. Over 500, it hugs the real number.
This is why casinos do not panic after a bad Tuesday night. They know their 5.26% edge needs thousands of bets to show itself reliably. A single high roller on a lucky streak is noise. The month-end balance sheet is signal.
Your equity curve works the same way. The daily shape is noise. The quarterly slope is signal.
Walkthrough: The Trader Who Quit Too Soon
A trader runs a GBP/USD strategy during the London session. After backtesting, the numbers show a 48% win rate with a 3:1 average reward-to-risk. That is a positive expectancy strategy.
Week one: 2 wins, 4 losses out of 6 trades. Risk per trade is 1% of a $10,000 account, so $100 per trade.
2 wins at 3:1 = 2 times $300 = $600 gained.
4 losses at 1:1 risk = 4 times $100 = $400 lost.
Net: +$200.
Not bad. But the trader expected more wins and feels uncertain.
Week two: 1 win, 5 losses out of 6 trades.
1 win at 3:1 = $300 gained.
5 losses = 5 times $100 = $500 lost.
Net: -$200.
Combined two-week result: 3 wins, 9 losses. That is a 25% win rate over 12 trades. The trader panics, scraps the strategy, and starts searching for a new one.
But the actual win rate over 200 backtested trades was 48%. The two-week result was pure variance. If the trader had taken 100 more trades, the observed rate would have drifted back toward 48%, and the 3:1 payoff ratio would have generated consistent profit.
Short-Term Noise vs Long-Term Signal
The real danger of variance is not the losses themselves. It is the decisions you make because of them.
Here are the three most common variance traps:
1. Strategy hopping after a drawdown. Five losing trades in a row feels terrible. But a 50% win rate strategy has roughly a 3% chance of five consecutive losses in any given stretch. Over 200 trades, it is almost guaranteed to happen at least once. That is not a broken system. That is math.
2. Sizing up after a winning streak. Four winners in a row does not mean your edge improved. It means variance clustered in your favor temporarily. If you double your lot size based on that cluster, the inevitable mean reversion hits twice as hard.
3. Changing rules mid-sample. Every time you tweak an entry rule, exit rule, or filter, you reset the sample clock to zero. You never get enough data for the law of large numbers to work because you keep restarting.
What to Measure Instead of Weekly PnL
If short-term results are unreliable, what should you actually track?
Expectancy per trade. This is the average dollar amount your strategy produces per trade over a meaningful sample. Calculate it as (win rate times average win) minus (loss rate times average loss). One week of data is useless here. You need at least 50 to 100 trades to get a number worth trusting. Read more about how expectancy works.
Discipline rate. What percentage of your trades followed your plan exactly? This is something you can measure on day one, and it does not care about variance. If 90% of your trades were on-plan, you are doing your job regardless of PnL.
Process metrics over time. Win rate, average R, profit factor. All of these need sample size to stabilize. Track them monthly or quarterly, not daily. Your trading performance review should compare quarter-over-quarter trends, not week-over-week swings.
Walkthrough: Same Strategy, Two Different Months
A trader uses a EUR/USD supply and demand strategy. True expectancy from backtesting: 52% win rate, 2:1 reward-to-risk, risking 1% per trade on a $25,000 account ($250 per trade).
Month 1 (18 trades): 13 wins, 5 losses. Observed win rate: 72%.
13 wins: 13 times $500 = $6,500 gained (each win is $250 times 2 = $500).
5 losses: 5 times $250 = $1,250 lost.
Net: +$5,250.
The trader feels invincible.
Month 2 (16 trades): 6 wins, 10 losses. Observed win rate: 37.5%.
6 wins: 6 times $500 = $3,000 gained.
10 losses: 10 times $250 = $2,500 lost.
Net: +$500.
The trader questions everything.
Combined (34 trades): 19 wins, 15 losses. Observed win rate: 55.9%.
The combined number is closer to the true 52%, but 34 trades is still too small to draw real conclusions. The two months felt completely different, but the strategy worked both times. The only thing that changed was the random distribution of outcomes.
The lesson: your edge does not live inside a single month. It lives across the full sample. React to Month 2 by switching strategies, and you throw away both months of data.
How to Build Patience Against Variance
Knowing variance exists intellectually and actually sitting through it are two different things. Here is what helps:
Set a review schedule, not a review trigger. Do not review performance after a bad day. Review performance on a fixed schedule (monthly minimum, quarterly is better). This removes the emotional trigger and forces you to look at real sample sizes.
Track trade-by-trade execution, not outcomes. Did you follow your entry rules? Did you place your stop where your plan said? Did you take profit at the right level? If yes, the trade was a success regardless of whether it hit your stop. Variance controls whether individual trades win. You control whether you follow the plan.
Pre-commit to a sample size. Before going live with any strategy, decide how many trades you will take before judging it. Write that number down. A good starting point: 100 trades, no rule changes.
How EdgeFlo Helps You See Past the Noise
EdgeFlo's trading dashboard tracks the metrics that actually matter across your full trading history, not just this week. Win rate, average R, profit factor, and EdgeScore all update as your sample grows, so you are always looking at a stabilizing number rather than a snapshot distorted by variance.
The AI-powered journal auto-imports every trade and tags it with your execution data. Over time, this gives you the dataset you need for a meaningful performance review. Instead of reacting to one bad week, you can open your dashboard and see three months of data telling you whether your edge is real.
When the short-term noise is loudest, structure keeps you from making the worst decision. EdgeFlo does not remove variance. Nothing can. But it gives you the visibility to stop treating noise like signal.
How many trades do I need before I can trust my results?
Is a 60% win rate over 20 trades meaningful?
What is the difference between variance and expectancy?
Should I stop trading during a losing streak?

Turn discipline on.
Every session.
EdgeFlo is the environment serious traders operate inside.
Start 7-Day Trial — $7
Cancel anytime.
No long-term commitment.


Think Different, Trade Different.