

High Probability Trade Setups: Structure Alignment
The highest probability trades happen when internal and swing structure align in the same direction. Learn how to filter setups using structure alignment.

High probability trade setups come down to one filter: internal and swing structure pointing in the same direction. When both layers agree, the trend and the current momentum are aligned, and your entry has the strongest possible structural backing. When they disagree, you are trading against either the trend or the short-term flow. Most traders overcomplicate setup selection with dozens of indicators and confluence factors. Structure alignment is simpler, mechanical, and more effective than stacking five tools that all measure the same thing differently.
TL;DR
The highest probability setups happen when internal and swing structure are both moving the same way.
Misalignment (internal going one way, swing going another) means you are in a pullback. Do not trade.
Alignment is a binary filter: yes or no. No gray area.
This one filter eliminates the majority of losing trades caused by bad timing.
Build alignment checks into your pre-trade checklist as a hard gate.
What Makes a Setup High Probability
Probability in trading is not about predicting what price will do. It is about stacking conditions in your favor so that over a large sample, your wins outweigh your losses.
Most traders search for high probability setups by adding indicators. Moving average crossover plus RSI divergence plus volume spike plus a Fibonacci level. Four confirmations feel more reliable than one. But in practice, more indicators just create more reasons to hesitate, more ways to get conflicting signals, and more excuses to override your rules when two out of four agree.
Structure alignment replaces all of that with a single check. Are internal and swing structure pointing the same direction? If yes, take the trade. If no, wait.
Why does this work? Because market structure is the foundation that every other tool is built on. Moving averages smooth out structure. RSI measures structure momentum. Fibonacci retracements predict where structure will turn. If you read structure directly, you do not need the derivative tools.
The alignment filter works because it represents a state where both the larger trend (swing) and the current momentum (internal) agree. Buyers or sellers are dominant at both levels. When that happens, price tends to move further in that direction with less resistance.
Sound too simple? That is the point. Simple rules are easier to follow, easier to backtest, and harder to rationalize your way around.
Structure Alignment as a Filter
Alignment is binary. Not "mostly aligned" or "kind of aligned." Binary: yes or no.
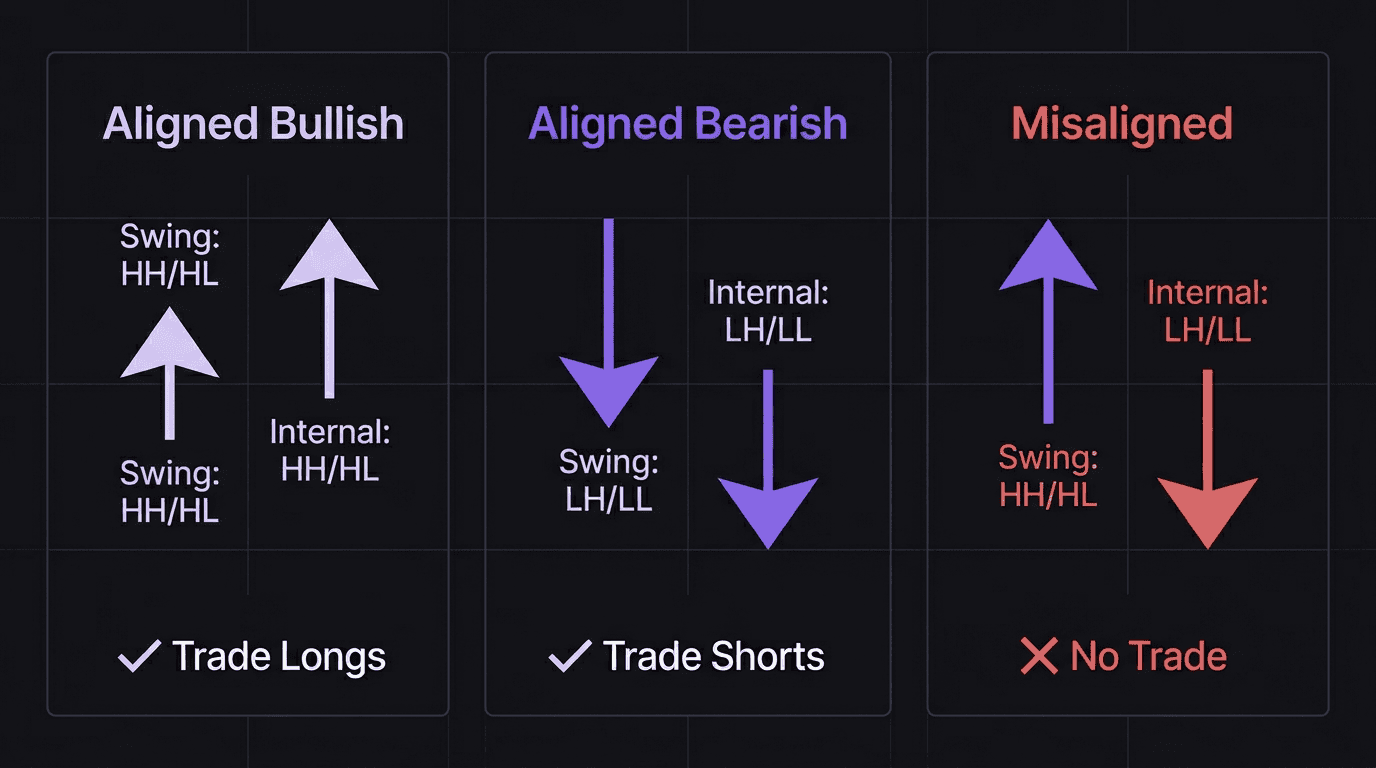
Aligned bullish: Swing structure is making higher highs and higher lows. Internal structure is also making higher highs and higher lows. Both layers are bullish. This is a green light for long trades.
Aligned bearish: Swing structure is making lower highs and lower lows. Internal structure is also making lower highs and lower lows. Both layers are bearish. This is a green light for short trades.
Misaligned: Swing structure is bullish but internal structure is bearish (pullback in progress). Or swing structure is bearish but internal structure is bullish (pullback in progress). This is a red light. No trades.
Write this into your mechanical trading plan as Rule Number One. Before you check your entry zone, before you measure risk-to-reward, before you look at any indicator: "Is structure aligned?" If the answer is no, close the chart. Go for a walk. Come back when the structures agree.
The Filter in Action
Here is what the alignment filter does to your trade quality over time:
Without the filter, you take trades during pullbacks, during transitions, during chop. Some win. Many lose. Your win rate sits around 40 to 45%, and your equity curve is choppy.
With the filter, you only trade when both layers agree. You take fewer trades. But the ones you take have structural momentum behind them. Your win rate climbs to 55 to 60%, and the wins tend to run further because you entered with the flow, not against it.
Fewer trades, better trades. That is the trade-off. And it is a trade-off worth making.
When Internal Matches Swing
The moment of alignment is specific. Here is exactly what it looks like.
Scenario: bullish swing, pullback in progress.
Price is in a bullish swing trend (HH/HL). A pullback starts: internal structure shifts bearish as price makes internal lower highs and lower lows. At this point, structures are misaligned. Swing is bullish, internal is bearish. No trade.
Price reaches a demand zone. Buyers step in. Internal structure makes a higher low, then a body close breaks above the previous internal high. Internal structure is now bullish again. Both layers match.
This is your entry window.
Example: EUR/JPY 1H chart, bullish swing structure.
Swing low at 162.80, previous swing high broken at 163.50 (new HH). Price pulls back. Internal structure shifts bearish at 163.20 as the body closes below the internal low at 163.30.
The pullback deepens. Price drops to 162.95, near the swing higher low zone. Internal structure is still bearish (lower highs, lower lows within the pullback).
At 162.95, demand arrives. Price makes an internal higher low at 163.00, then breaks the internal high at 163.15 with a body close. Internal structure is now bullish.
Alignment is confirmed. Both swing (HH/HL) and internal (now HH/HL) are bullish.
A trader enters long at 163.18, stop below the internal higher low at 162.95 (23 pips risk). Target is the swing high area at 163.50 (32 pips), giving roughly 1.4:1 reward-to-risk. With a higher probability setup, even modest R:R becomes profitable over a sample of 50+ trades.
The power of this entry is not the R:R ratio. It is the probability that price continues higher. Both structure layers are bullish. The pullback confirmed and reversed at a logical zone. The wind is at your back.
How to Wait for Alignment
Waiting is the hardest part. Not because the concept is difficult, but because the market tempts you constantly.
You see price sitting in a demand zone. Swing is bullish. The zone looks perfect. But internal structure is still bearish: the pullback has not confirmed its end. Everything in you wants to enter "just a little early."
Do not.
What NOT to do: NZD/USD 4H chart.
Swing structure is bearish (LH/LL). Price rallies into a supply zone at 0.5720. The zone is clean. The swing trend supports a short. A trader enters short at 0.5718.
But internal structure is still bullish. The pullback is still pushing higher. Price continues to 0.5745 before internal structure finally shifts bearish (body close below 0.5730). The trader who waited for alignment enters at 0.5728, with a stop above the internal lower high at 0.5745 (17 pips risk). The trader who entered early at 0.5718 now has 27 pips of drawdown and a much wider stop.
Both traders are short. But the early trader has worse risk, worse psychology, and spent 6 candles watching their position underwater.
Practical Waiting Rules
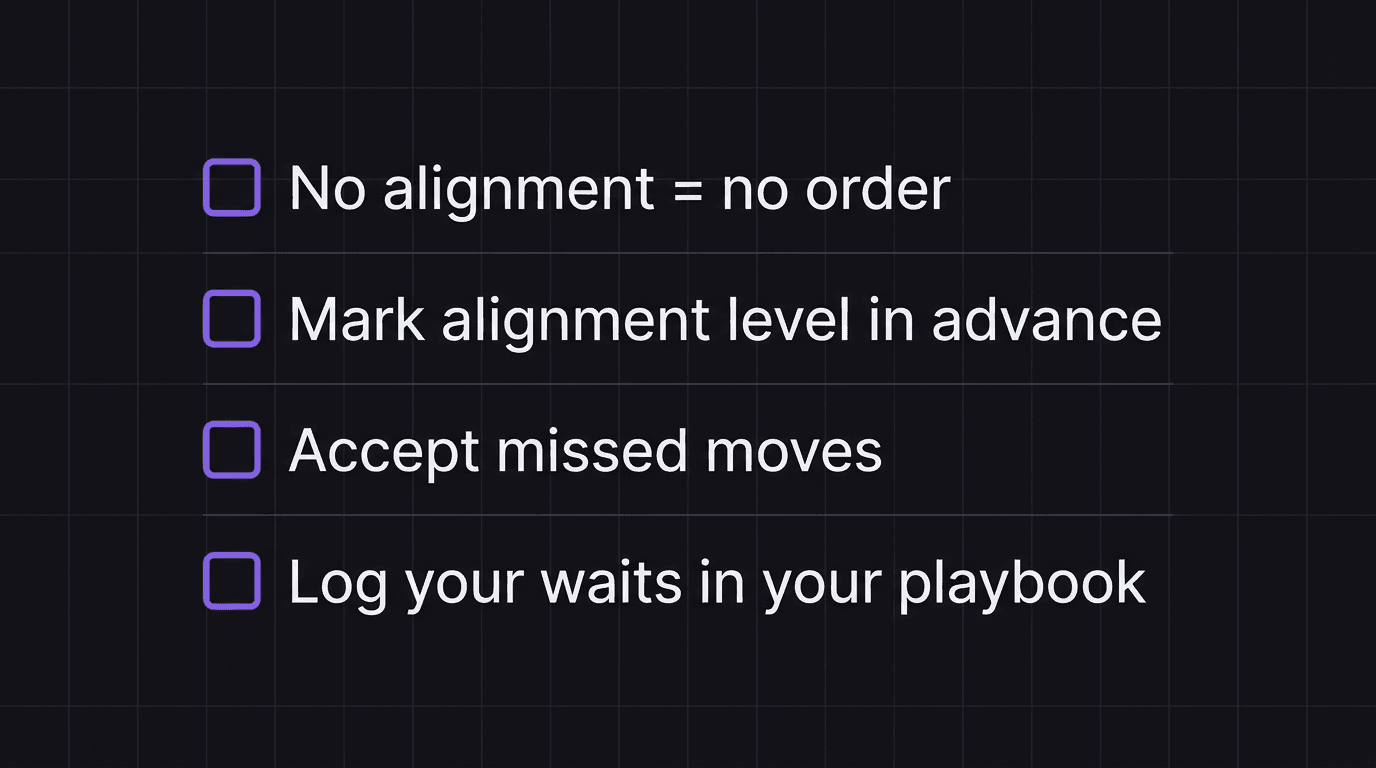
Rule 1: No alignment, no order. Do not even place a limit order until internal structure confirms. Limit orders placed during misalignment are guesses dressed up as plans.
Rule 2: Mark your alignment level in advance. Before the internal shift happens, identify which internal level needs to break for alignment to occur. Write it down. When that level breaks with a body close, you are ready.
Rule 3: Accept missed moves. Sometimes internal structure never shifts back. Price just keeps pulling back and eventually breaks the swing level too. That was not your trade. You did not miss anything. You avoided a loss.
Rule 4: Log your waits. In your trading playbook, note when you waited for alignment and the outcome. Also note when you did not wait and the outcome. After 30 entries, the data will make the case for you.
What If Alignment Never Comes?
Some days, the structures never align during your trading window. Internal stays against swing for the entire session. This feels like a wasted day.
It is not. A day with zero trades and zero losses is better than a day with three forced trades and three losses. Your job is not to trade every day. Your job is to trade when conditions support your plan. If alignment does not show up during your session, walk away. The market will be there tomorrow.
How EdgeFlo Helps You Trade Structure Alignment
EdgeFlo keeps your alignment rules in front of you throughout your session. Your plan includes the specific structural conditions required before you enter, and it stays visible next to your chart. When the temptation to enter early hits, the rule is right there, reminding you what you committed to.
The journal tracks whether your entries had structure alignment or not. After a month, you can filter your journal to see win rate on aligned trades versus misaligned trades. That data, from your own account, is the most persuasive evidence you will ever see for why alignment matters.
EdgeFlo also prompts you with a pre-trade check before you submit an order. "Is internal aligned with swing?" appears on your checklist. It is a 3-second confirmation that can save you from the trades you would regret.
The Edge Brief
Receive Insights on trading psychology, discipline, and the behavioral patterns that create consistent traders from our Founder and the EdgeFlo team, delivered to your inbox.
Think different. Trade different.
What makes a trade setup high probability?
How do you know if internal and swing structure are aligned?
Should you ever trade when structures are misaligned?
How long do you wait for structure alignment?

Turn discipline on.
Every session.
EdgeFlo is the environment serious traders operate inside.
Start 7-Day Trial — $7
Cancel anytime.
No long-term commitment.


Think Different, Trade Different.