

Grade Every Trade: What Your Distribution Reveals
Grade every trade on process quality using an A, B, C framework. Your grade distribution reveals whether you have a strategy problem or an execution problem.

When you grade every trade on process quality instead of P&L, you finally see whether your problem is the strategy or the person running it. Most traders never make this distinction. They blame the strategy after a losing week when the real issue was poor execution on 40% of their trades.
Trade grading separates the signal from the noise. Your grade distribution across 30, 50, or 100 trades tells you exactly where the leaks are. And unlike win rate, your grade distribution is something you can directly control.
TL;DR
Grade trades A, B, or C based on how well you followed your plan, not whether the trade won.
A = every rule followed. B = minor deviation. C = significant rule break.
Your grade distribution over 50 trades reveals whether you have a strategy problem or an execution problem.
If 50% or more of your trades are A-grade, your strategy gets a fair test. Below that, you are running noise.
Shift the distribution by targeting one specific C-grade behavior per month.
Why Every Trade Needs a Grade
Think about how you currently evaluate trades. If you won, it was a good trade. If you lost, it was a bad trade. Sound familiar?
This outcome-based thinking is the single biggest obstacle to improvement. It teaches you the wrong lessons. A sloppy trade that wins reinforces bad habits. A textbook trade that loses makes you doubt a perfectly valid strategy.
Grading by process flips this. When you grade every trade on execution quality, a losing A-trade is a success and a winning C-trade is a warning. The grade measures you, not the market.
Over time, your grade distribution becomes the most important page in your journal. It shows whether you are getting better at doing the right things, which is the only part of trading you actually control.
The Grading Framework
Keep it simple. Three grades are enough. More than three adds complexity without adding insight.
A-Grade: Perfect Execution
Every rule in your plan was followed. The setup met all entry criteria. Your position size matched your risk rule. You entered at the right time. You managed the trade according to plan. You exited at the planned target or stop.
An A-grade trade can lose money. That is fine. A perfectly executed trade that hits your stop loss is not a failure. It is probability doing its job. These are good losses. Over 100 trades, your A-grade trades should produce results close to your backtested expectancy.
Save screenshots of A-grade trades, both winners and losers. The winners show you what to look for. The losers show you that following your rules sometimes means taking a loss, and that is part of the game.
B-Grade: Minor Deviation
You followed most of your rules but deviated on one. Maybe you entered 3 pips early because you jumped the candle close. Maybe your stop was 2 pips tighter than your standard calculation. Maybe you hesitated and entered late, getting a slightly worse price.
B-grades are not alarming on their own. Every trader has imperfect entries. But if your B-grade count is growing week over week, you are drifting. B-grades tend to become C-grades when the market gets volatile and pressure increases.
In your journal, note the specific deviation. "Entered 1 candle early" is useful data. "Could have been better" is not.
C-Grade: Significant Rule Violation
You broke a core rule. Traded outside your session. Entered without a valid setup. Doubled your position size. Moved your stop loss wider. Traded during news when your plan says not to.
C-grade trades are the expensive ones. Not because they always lose (sometimes they win, which is worse because it reinforces the behavior), but because they degrade your data. Every C-grade trade dilutes the statistical validity of your strategy. If 40% of your trades are C-grade, you do not actually know whether your strategy has an edge. You have never given it a fair test.
Walkthrough: Grading a Full Week
Monday: Long GBP/USD at 1.2640 after demand zone confirmation on the 15-minute chart. Stop at 1.2615 (25 pips). Target at 1.2700 (60 pips). Followed every rule. Hit target. Grade: A (win)
Tuesday: Long EUR/USD at 1.0835. Entered 2 candles early because price was moving fast. Stop at 1.0810 (25 pips). Target at 1.0885 (50 pips). Hit stop. Grade: B (loss) Minor deviation: entered before confirmation candle closed.
Wednesday: No valid setups. Did not trade. Grade: N/A (no trade is not gradable, but not trading when there is no setup is correct behavior)
Thursday: Short EUR/USD at 1.0870 during New York afternoon. Plan says London session only. Won 30 pips. Grade: C (win) Significant violation: traded outside approved session window.
Friday: Long GBP/USD at 1.2680. All rules followed. Hit stop at 1.2655. Grade: A (loss)
This week: 2 A-grades, 1 B-grade, 1 C-grade across 4 trades. The C-grade win on Thursday is the most dangerous result of the week because it rewards rule-breaking.
What Your Grade Distribution Reveals
After 50 trades, count your A, B, and C grades. The distribution tells you something specific.
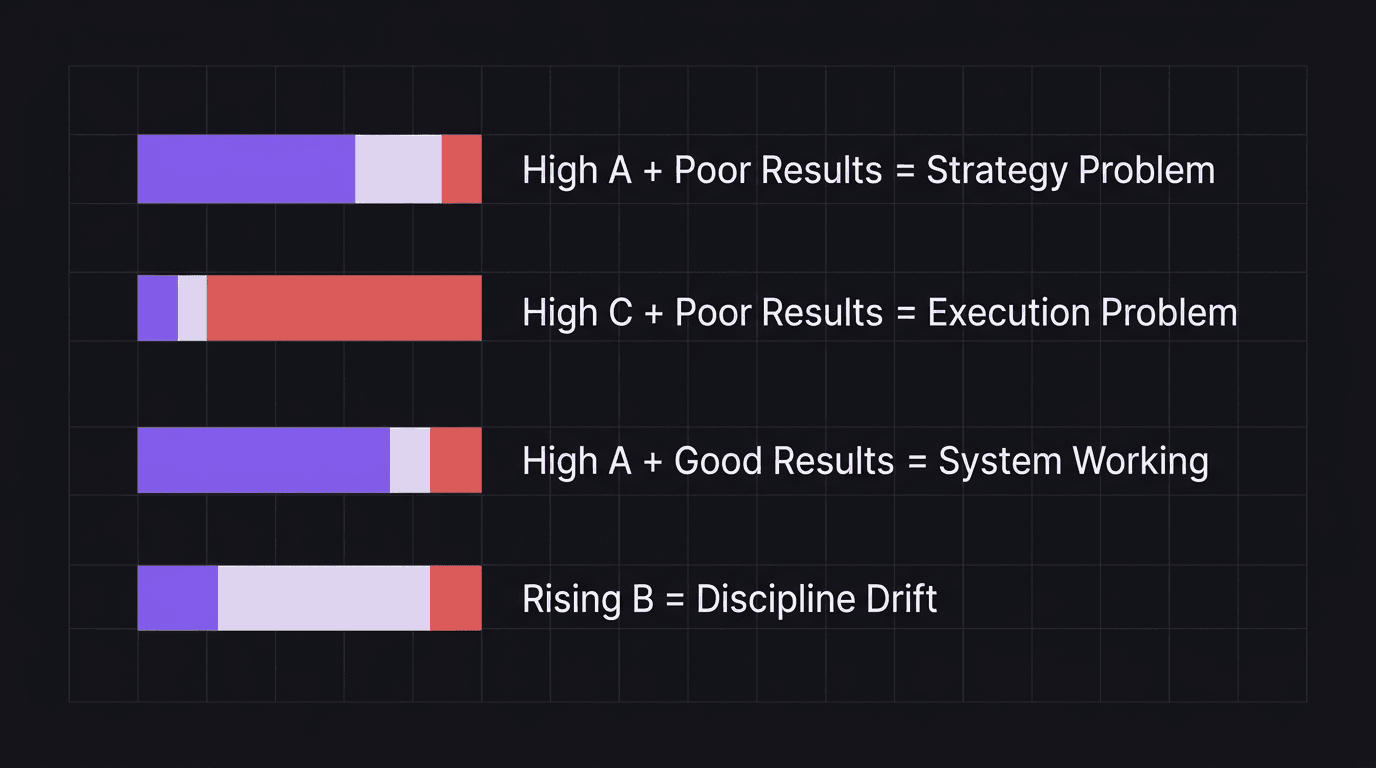
Mostly A-grades (50%+), poor results: Your strategy might need adjustment. You are executing well, so the problem is probably in the plan itself. Time for a strategy review.
Mostly C-grades (30%+), poor results: Your strategy has never gotten a fair test. Before changing anything about your plan, fix your execution. Get C-grades below 20% first.
High A-grade count, good results: Your system is working. Protect it. Do not over-optimize. Do not add complexity. Keep executing.
Rising B-grade count over time: You are drifting. B-grades are the early warning. If B-grades are climbing from 20% to 35% over three months, you are slowly losing discipline. Catch it before B becomes C.
Shifting the Distribution Over Time
You cannot fix everything at once. If you have 35% C-grade trades, trying to eliminate all of them next week will not work. Instead, focus on the single most common C-grade behavior.
Pull up your journal data and sort your C-grade trades by the rule violated. Find the one that appears most often.
Maybe it is "entered without waiting for confirmation candle close" (5 out of 8 C-grades). That is your target for the next month. Every other C-grade behavior stays on the list, but you are only actively working on one.
Set a specific measurable goal: "Reduce 'entered before candle close' C-grades from 5 per month to 2 or fewer."
After one month, check the numbers. If you hit the target, pick the next most common C-grade behavior. If you did not, keep working on the same one.
This approach works because it is focused. Trying to fix "bad discipline" is too vague. Trying to fix "I enter before the candle close when price moves fast" is concrete and trackable.
Over six months of targeting one C-grade behavior per month, traders typically see their overall distribution shift from something like 40A/25B/35C to 55A/30B/15C. That shift alone, without changing a single strategy rule, often turns a break-even trader into a profitable one.
Walkthrough: Targeting One C-Grade Behavior
A trader reviews 60 trades from Q1. Distribution: 24 A-grades (40%), 18 B-grades (30%), 18 C-grades (30%).
C-grade breakdown: - Entered before confirmation: 8 trades - Traded outside session: 5 trades - Oversized position: 3 trades - Moved stop wider: 2 trades
Target for April: reduce "entered before confirmation" from 8 per month to 3 or fewer.
Tactic: Add a physical sticky note to the monitor that says "Wait for the close." Before every entry, verbally say "Is the candle closed?" If no, hands off the keyboard.
April result: 2 "entered before confirmation" C-grades. C-grade total drops from 18 to 12. Distribution shifts to 28A/18B/12C (48%/31%/21%). Progress.
How EdgeFlo Supports Trade Grading
EdgeFlo's post-trade self-reporting asks you to grade each trade against your documented plan immediately after closing the position. The grade goes into your journal alongside the P&L data, so you never lose context.
The trading dashboard tracks your grade distribution over time, showing whether your A-grade percentage is climbing or slipping. You can filter by grade to see the P&L of just your A-trades versus just your C-trades, which makes the cost of rule-breaking visible in hard numbers.
And because your plan lives inside EdgeFlo's Edge feature, the system knows what your rules are. When you report a deviation, the pattern gets flagged in your weekly AI report (Plus plan), so you do not have to manually hunt for repeat offenders.
What does it mean to grade a trade?
How many grade levels should I use?
What does a healthy grade distribution look like?
Should I grade winning and losing trades the same way?

Turn discipline on.
Every session.
EdgeFlo is the environment serious traders operate inside.
Start 7-Day Trial — $7
Cancel anytime.
No long-term commitment.


Think Different, Trade Different.