

How to Forward Test Your Trading Plan in 30 Minutes a Day
Forward test your trading plan in 30 minutes daily. Review yesterday's price action, mark up three timeframes, simulate entries, and log results.

Forward testing is the bridge between backtesting and live trading. You apply your mechanical trade plan to the last 24 hours of live price action, simulate entries, annotate your charts, and log the results. Done daily, it builds proof that your plan works in real market conditions before you risk real capital.
Most traders skip this step entirely. They finish forward testing after a weekend of backtesting, feel confident, and jump straight to a live account. Then the first losing streak hits and they have zero data to fall back on. Forward testing fixes that gap.
TL;DR
Forward testing means applying your trade plan to the past 24 hours of live data, not historical charts.
Mark up three timeframes (higher, medium, lower) and simulate entries with stops and targets.
Screenshot every setup, annotate your thought process, and log the R-multiple outcome.
Do this for at least 100 sessions before going live to build real confidence in your plan.
The data you collect during forward testing becomes the proof that separates guessing from trading.
What Forward Testing Actually Looks Like
Forward testing is not watching a chart and thinking "I would have bought there." It is a structured process where you review yesterday's price action, apply your exact trade plan rules, and document the outcome.
Here is what a single forward test produces: a higher-timeframe narrative, a medium-timeframe entry zone, a lower-timeframe trigger, a simulated entry with stop and target, and a logged R-result. That is one data point. You need at least 100 of them.
The key difference from backtesting is context. Backtesting uses old data where you already know the outcome. Forward testing uses yesterday's live data, which means you are building the narrative without knowing exactly what happened next. You are forecasting, not reviewing.
Walkthrough: One Forward Test on EUR/USD
You sit down at your desk on Thursday morning. You open EUR/USD on TradingView and look at the daily chart. Price broke above the last swing high on Wednesday, creating a bullish break of structure. You mark the swing range, identify a demand zone just below the midpoint, and note the supply zone above.
You drop to the 1-hour chart. Price pulled back into the demand zone overnight and formed a lower-high, lower-low sequence before reversing. There is a flip zone where supply turned to demand.
You drop to the 15-minute chart. Price swept the lows at the demand zone, then created a market shift with a break above the last lower high. You simulate a long entry at the edge of the demand zone (1.0845), place a stop below the zone at 1.0830 (15 pips), and set a target at the swing high at 1.0890 (45 pips).
15 pips risk, 45 pips reward. That is a 3R setup. You screenshot all three timeframes, annotate your logic, and log it.
You can do this on a demo account by placing real simulated orders, or you can use TradingView's built-in long/short position tool. Either way, the point is the same: apply your plan to live data and record the result.
The 30-Minute Daily Review Process
Thirty minutes is enough if you stay focused. Split it into three blocks.
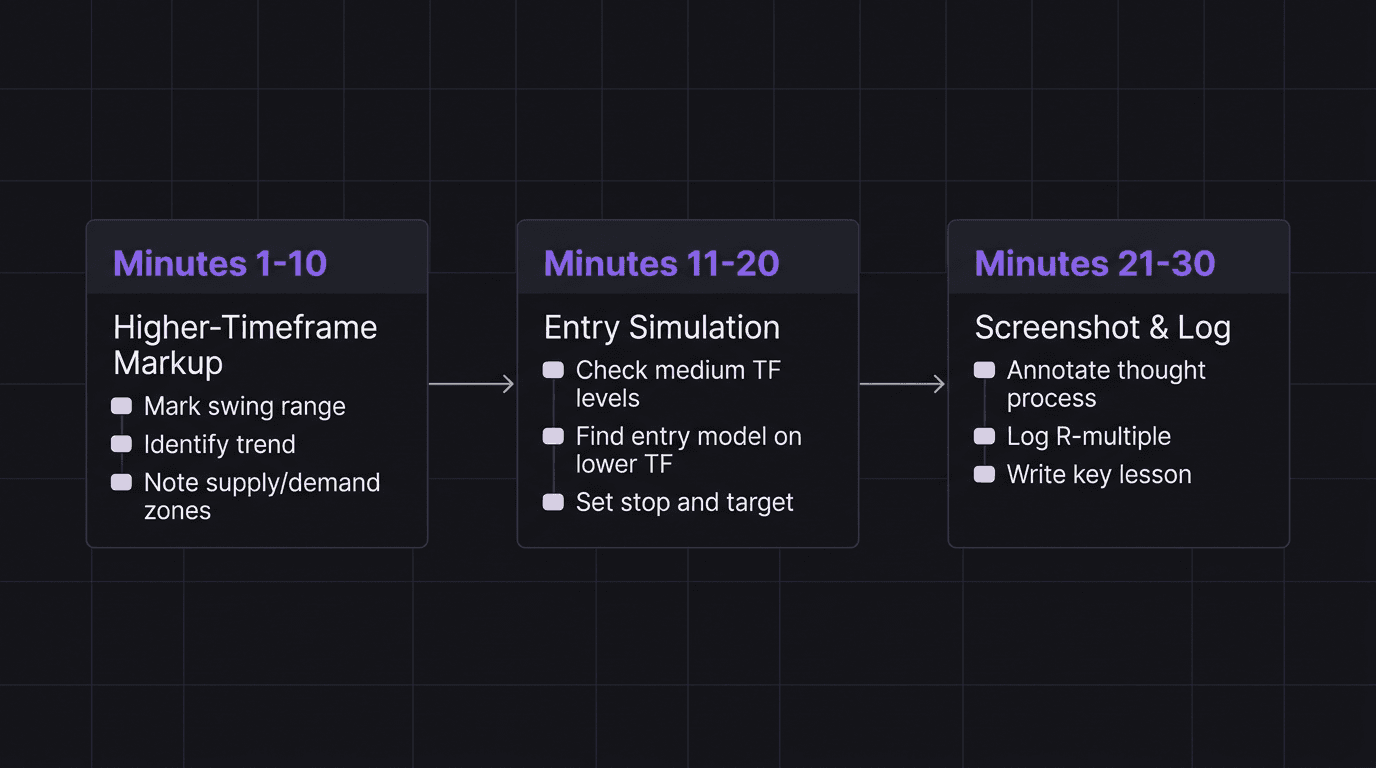
Minutes 1 to 10: Higher-Timeframe Markup. Open the daily chart of your primary pair. Identify the current swing range (the most recent swing high and swing low). Determine trend direction based on structure. Mark your premium and discount zones. Note any key supply or demand levels. Write one sentence summarizing the narrative: "Price is bullish, pulling back into discount, demand zone at X."
Minutes 11 to 20: Medium and Lower-Timeframe Entry. Drop to your medium timeframe (1-hour or 4-hour). Look at the past 24 hours of price action. Did price reach any of your higher-timeframe levels? If yes, check for your entry model on the lower timeframe (15-minute or 5-minute). Simulate the entry, place the stop, and set the target. If no valid setup exists, log "No setup" and move on. Not every day produces a trade, and that is data too.
Minutes 21 to 30: Screenshot, Annotate, and Log. Screenshot all three timeframes. Annotate each screenshot with your thought process (not just what happened, but why you made each decision). Log the R-multiple of the simulated trade. Write one key lesson from the session.
This process works for day traders reviewing the previous session and for swing traders reviewing the previous week. The cadence changes, but the structure stays the same.
Screenshot, Annotate, and Log Every Setup
A raw screenshot teaches you nothing. You will look at it next week and have no idea why you took that trade or what you were thinking. Annotation is what turns a screenshot into a lesson.
Here is what to annotate on every screenshot:
Structure labels. Mark the swing high, swing low, and trend direction. Label any break of structure or market shift.
Zone identification. Highlight the supply zone, demand zone, or flip zone that triggered your interest.
Entry logic. Write exactly why you entered where you did: "Entered at edge of demand after break of structure confirmation on 15M."
Invalidation. Mark where your trade idea becomes wrong. "Below this low, the bullish thesis is dead."
Outcome. Did price hit the target, the stop, or neither? If the session has not played out yet, come back and fill this in.
Log the R-multiple for every simulated trade. If your stop was 15 pips and your target was 45 pips and price hit the target, that is +3R. If it hit the stop, that is -1R. Over 100 trades, these R-values tell you exactly how your plan performs.
Your trading journal should have a dedicated section for forward test data. Keep it separate from live trades so you can compare performance between simulated and real execution later.
Walkthrough: What Bad Annotation Looks Like
You screenshot a GBP/USD 15-minute chart showing a long entry at 1.2650. No labels. No zones marked. No explanation of why you entered. Two weeks later, you open this screenshot and it means nothing. You cannot tell if the trade was part of your plan or a random impulse. You cannot learn from data you cannot read.
Compare that to the same chart with three annotations: "Demand zone 1.2640 to 1.2655 (from daily)", "BOS confirmed at 1.2662 on 15M", and "Entry at zone edge, SL below zone at 1.2635, TP at swing high 1.2700." Now you have a story. Now you can review it.
Forward Testing vs Backtesting: What Each Proves
Backtesting proves your rules work on historical data. Forward testing proves you can apply those rules in real time without the benefit of knowing what happens next.
Both are necessary. Neither is sufficient alone.
Backtesting answers: "Does this strategy have a statistical edge over 200 or more historical setups?" It is fast, you can process months of data in a weekend, and it gives you baseline numbers for win rate, average R, and expectancy.
Forward testing answers a different question: "Can I identify setups, execute entries, and manage trades in real-time conditions?" This is where you discover that the edge you found in backtesting falls apart when you have to make decisions without seeing the right side of the chart.
Most traders find that their forward testing results are worse than their backtesting results. That gap is real, and it is important. It reveals the difference between seeing setups in hindsight and finding them in real time. Closing that gap is the entire point of building a proven edge.
Forward testing also tests your process, not just your strategy. Are you actually following your plan? Are you entering at the zone or chasing? Are you placing stops where your rules say, or tightening them because the trade "feels" risky? Your review process should catch these execution gaps.
How EdgeFlo Turns Forward Tests Into Journal Entries
EdgeFlo's trading journal is built for exactly this workflow. You screenshot your chart markups, attach them to a journal entry, and add notes about your thought process and the setup logic. Each entry stores the R-multiple alongside your annotations, so your forward test data accumulates in the same place as your live trading data.
Over time, your journal becomes a searchable database of forward test results. You can filter by pair, by session, by entry type, and see which variables consistently produce positive R. That is how forward testing data turns into trading confidence: not through feelings, but through proof you can measure.
When you are ready to move from forward testing to live trading, the transition is seamless because your journal structure stays the same. The only thing that changes is whether real money is on the line.
How many forward tests should I do before going live?
Can I forward test on TradingView instead of a demo account?
What is the difference between forward testing and paper trading?
How long does each forward testing session take?

Turn discipline on.
Every session.
EdgeFlo is the environment serious traders operate inside.
Start 7-Day Trial — $7
Cancel anytime.
No long-term commitment.


Think Different, Trade Different.