

False Breakout Recovery: Cut and Wait for the Real Move
False breakouts cost money only when you hold. Learn to spot failed structure breaks early, cut the trade, and prepare for the real move in the opposite direction.

You see price break past a key level. The candle closes below the swing low, or above the previous high. You enter because the breakout is confirmed. Then price immediately reverses, blows through your entry, and runs in the opposite direction.
That is a false breakout. And it is not just bad luck. It is a structural trap that happens at predictable locations, for predictable reasons. The traders who got caught provided the liquidity for the real move.
The damage from a false breakout is not the initial loss. That is just 1R if your stop is in the right place. The real damage comes from what happens next: holding the trade hoping it will come back, moving your stop loss further away, or immediately revenge trading to recover the loss. Those reactions turn a manageable loss into an account problem.
TL;DR
False breakouts happen when price breaks a structural level but fails to sustain the move.
They are structural traps, not random events, and they often precede the real move in the opposite direction.
The correct response is: accept the loss, cut the trade, then wait for confirmation of the reversal.
Never move your stop further away after a false breakout. Accept the 1R loss.
The real trading opportunity is often the reversal trade that follows the false breakout.
Why False Breakouts Happen
False breakouts are not market noise. They are a function of how liquidity works.
Below every swing low sits a cluster of stop-loss orders from traders who are long. Above every swing high sits a cluster of stop-loss orders from traders who are short. These stop-loss orders represent pending sell orders (below swing lows) and pending buy orders (above swing highs).
When price breaks past a swing point, it triggers those stop-loss orders. That burst of volume provides the liquidity for larger participants to fill their positions in the opposite direction.
So the false breakout is not an accident. Price moved to that level specifically to access the liquidity sitting there. Once the stops are triggered and the orders are filled, there is no more reason for price to continue in the breakout direction. It reverses.
Understanding this does not prevent you from getting caught. You will still take breakout trades that fail. But it changes your response, because you know the false breakout is a setup for the real move, not a signal that your analysis was wrong.
How to Identify a False Breakout Early
You cannot know for certain whether a breakout is real or false in real time. But you can watch for warning signs that tilt the probability.
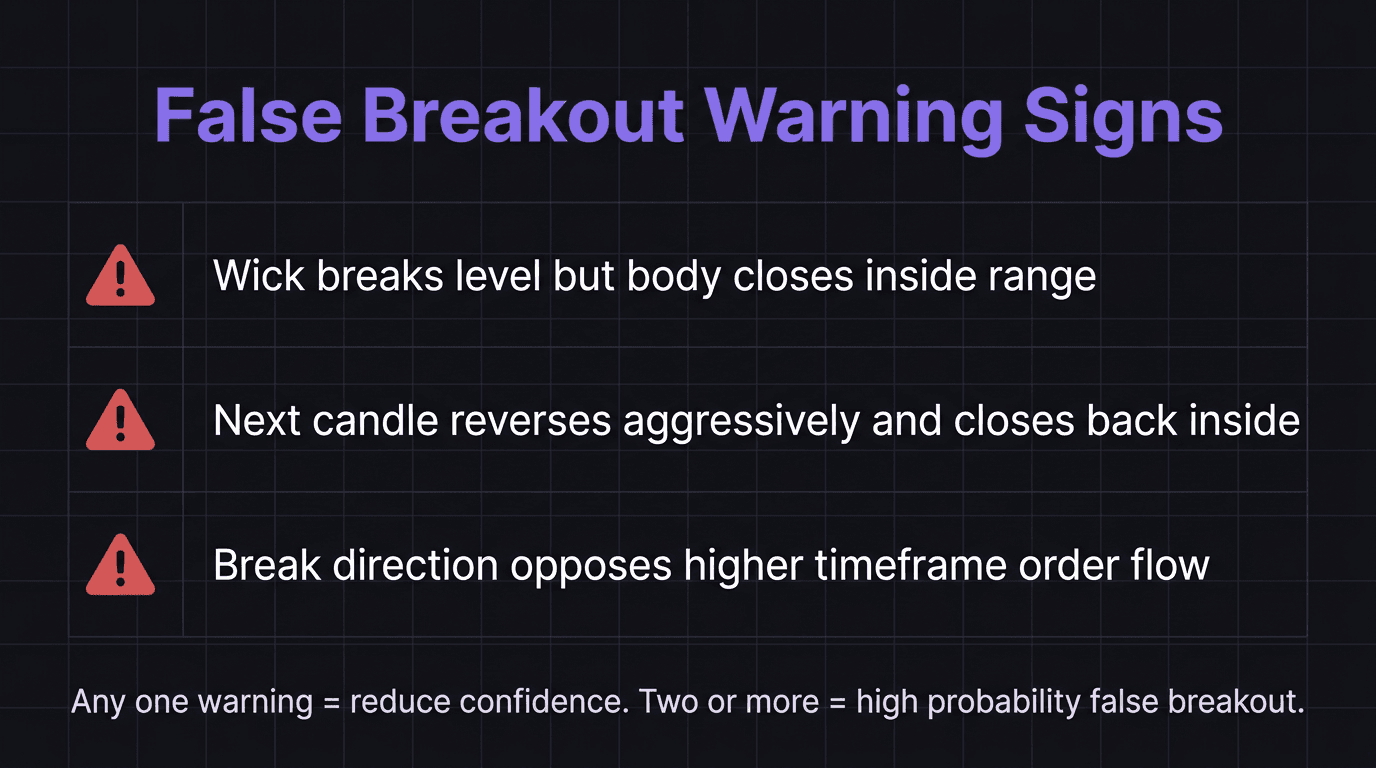
Warning Sign 1: Wick Break Without Body Close
If price breaks a swing level with a wick but the candle body closes back inside the range, the break is suspect. A wick break is a liquidity grab, not a structural break. Structural breaks require a body close beyond the level.
Warning Sign 2: Immediate Reversal Candle
Price breaks the level, closes beyond it, but the very next candle reverses aggressively and closes back inside the range. This creates a failed reaction. The break happened, but the market could not sustain it.
In order flow terms, this is often a demand zone or supply zone coming into play from the opposite side. The breakout triggered liquidity, and that liquidity was used to fuel the reversal.
Warning Sign 3: Break Against the Higher Timeframe Flow
If the swing order flow on your higher timeframe is bullish, a bearish break on the lower timeframe is already fighting the dominant structure. These breaks are more likely to fail because the higher timeframe order flow has more structural weight.
The most dangerous false breakouts happen when traders only look at one timeframe. On the lower timeframe, the break looks clean. But on the higher timeframe, the break is just a temporary liquidity grab inside a pullback.
Walkthrough: Getting Caught and Recovering Correctly
You are watching EUR/JPY on the 15-minute chart. The internal order flow is bearish. Price has been making lower highs and lower lows. There is a weak swing low at 162.40. Price pushes down and breaks below 162.40 with a body close at 162.35.
You enter short at 162.33. Stop loss at 162.50 (above the last internal lower high). Target at 161.90. That is a 17-pip stop and a 43-pip target, giving you a 1:2.5 risk-to-reward.
Math check: Risk is 17 pips. At 0.3 lots on EUR/JPY (pip value approximately $2.25 per pip at 0.3 lots), that is $38.25 risk. Target is 43 pips = $96.75 reward. Risk-to-reward: $96.75 / $38.25 = 2.53:1.
Two candles later, price reverses. A strong bullish candle pushes through 162.40 and closes at 162.48. Your stop at 162.50 is two pips away.
Here is where the decision matters.
Wrong response: You move your stop to 162.60 because "price might come back down." That adds 10 pips of risk that you did not plan for. Price hits 162.55 and stalls. You move the stop again to 162.70. Now you are 37 pips underwater on a trade that was supposed to risk 17.
Correct response: Your stop is at 162.50 for a reason. If it gets hit, you lose $38.25. That is your planned risk per trade. Accept it. Do not move the stop.
Price hits 162.50. You are out for a 17-pip loss ($38.25). Done. One planned loss that does not affect your week.
The Recovery Trade: What Comes After the False Breakout
Here is the part that turns a loss into an opportunity. After the false breakout below 162.40, price reversed and pushed back above the level. That reversal tells you something: the break was a liquidity grab, not a real structural move.
Now you watch the internal order flow. If the internal structure shifts bullish (price breaks above the last internal lower high with a body close), that is your confirmation that the false breakout has become a reversal setup.
You look for the demand zone that formed around the false breakout level (near 162.35 to 162.40). Price pulls back into that demand zone and reacts. You enter long.
Stop loss below the false breakout low at 162.30. Target at the previous internal lower high at 162.65. That is a 10-pip stop and a 25-pip target, giving you a 1:2.5 risk-to-reward.
Math check: Risk is 10 pips. At 0.3 lots ($2.25/pip), that is $22.50 risk. Target is 25 pips = $56.25 reward.
Your net result from the two trades: lost $38.25 on the false breakout, gained $56.25 on the recovery. Net profit: $18.00. The false breakout did not wreck your session because you cut the first trade at the planned stop and then traded the reversal with confirmation.
Net math check: $56.25 minus $38.25 = $18.00 net profit.
That is the framework. Lose small on the false breakout. Win bigger on the recovery trade. The net is positive as long as you do not blow up the risk on the first trade.
The Emotional Trap After a False Breakout
Getting stopped out of a false breakout creates a specific emotional cocktail: frustration (the analysis was not "wrong"), self-doubt (maybe you cannot read structure), and urgency (you need to make it back).
That cocktail leads to two dangerous behaviors.
Revenge entry. You immediately re-enter in the same direction, ignoring the fact that the market just told you the breakout failed. You are not trading anymore. You are arguing with the chart.
Oversizing the recovery. You take the recovery trade but double your lot size to "make up for the loss." If the recovery trade also fails, you are now down 3R instead of 2R. That is how a drawdown spirals.
The antidote is simple but not easy: treat the false breakout loss as a planned business expense. You risked 1R. You lost 1R. That is what was supposed to happen when the trade went wrong. The process worked. Now move on to the next clean setup with the same lot size.
When to Walk Away Instead of Recovery Trading
Not every false breakout deserves a recovery trade. Sometimes the best move is no trade at all.
If the false breakout was your second or third loss of the session, consider whether you have hit your daily loss limit. Chasing recovery trades when you are already down for the day is a recipe for spiraling.
If the chart is messy after the false breakout (consolidation, overlapping zones, no clear internal structure), there may not be a clean recovery setup. Wait for clarity. The recovery trade is only high probability when the internal order flow shift is clean and the zone is well-defined.
If you feel frustrated or anxious after the stop-out, that emotional state will affect your execution on the recovery trade. Sometimes the most profitable thing you can do is close the chart, take a break, and come back when you can think clearly.
Building a False Breakout Response Plan
The time to decide how you will handle false breakouts is before they happen. Not in the moment when your stop just got hit and you are staring at the chart with clenched teeth.
Write it down:
If my breakout trade gets stopped out: Accept the 1R loss. Do not re-enter in the same direction.
Watch the reversal: Monitor the internal order flow for a shift in the opposite direction.
If confirmation appears: Enter the recovery trade with the same lot size (not larger).
If confirmation does not appear within 30 minutes: Move on to a different pair or close the chart.
If I have hit my daily loss limit: Stop trading for the day. No exceptions.
That plan removes decision-making from the most emotionally charged moment in your trading session. When the false breakout hits, you already know what to do.
How EdgeFlo Helps After False Breakouts
EdgeFlo's guardrails make the emotional spiral harder. If you have set a daily loss limit, the platform restricts trading after you reach it. You can override the restriction, but you have to make a conscious choice to continue. That friction is the difference between a controlled 2R loss day and a catastrophic 8R blowup.
The daily loss cap guardrail does not judge your analysis. It does not care whether the loss was a false breakout or a bad read. It simply prevents the damage that happens when you keep trading while emotional. You can always override it if you genuinely see a high-probability recovery setup. But having to click past the warning makes you pause, and that pause is often enough to interrupt the revenge cycle.
The Edge Brief
Receive Insights on trading psychology, discipline, and the behavioral patterns that create consistent traders from our Founder and the EdgeFlo team, delivered to your inbox.
Think different. Trade different.
What is a false breakout in trading?
How do I know if a breakout is real or false?
Should I trade in the opposite direction after a false breakout?
How can I limit losses from false breakouts?

Turn discipline on.
Every session.
EdgeFlo is the environment serious traders operate inside.
Start 7-Day Trial — $7
Cancel anytime.
No long-term commitment.


Think Different, Trade Different.