

Failed Reactions at Supply and Demand Zones: What They Tell You
When price reaches a supply or demand zone and fails to react, the zone is telling you something. Learn how to read failed reactions and adjust your bias.

When price reaches a supply or demand zone and does not bounce, that is not random. The zone is telling you something. Either the orders that created it are exhausted, or the opposing pressure from a larger timeframe is too strong. Either way, a failed reaction changes your bias.
Most traders treat zones as guaranteed reversal points. They place a limit order, walk away, and get stopped out when the zone breaks. Reading failed reactions is how you avoid being on the wrong side of a zone that has already lost its power.
TL;DR
A failed reaction happens when price enters a zone and does not reverse with conviction.
Failed zones signal order exhaustion (resting orders are absorbed) or opposing pressure from a higher timeframe.
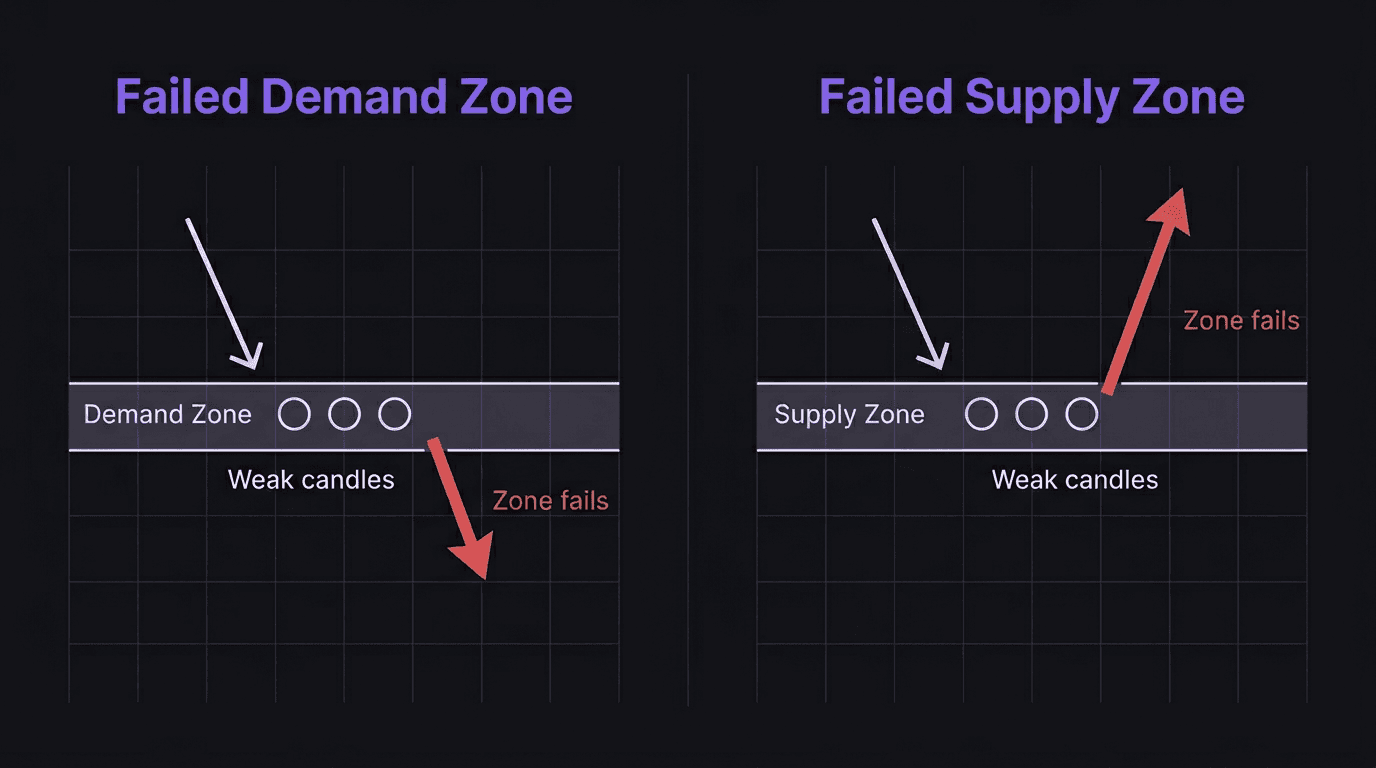
Failed demand zones flip bearish. Failed supply zones flip bullish. Adjust your bias immediately.
First-touch zones have the highest reaction probability. Second and third touches weaken progressively.
Log zone failures in your journal to build data on which zone types hold and which break.
What a Failed Reaction Looks Like
A healthy zone reaction is obvious. Price reaches the zone, and within a few candles, you see a strong move in the opposite direction. The candles are decisive: large bodies, small wicks, momentum.
A failed reaction looks different. Price enters the zone and sits there. Candles are small. Bodies are indecisive. Price grinds through the zone slowly, absorbing the resting orders without any sharp reversal. Sometimes price exits the other side entirely.
Here are the visual signatures of a failing zone:
Weak candles inside the zone. Dojis, spinning tops, and small-bodied candles inside the zone mean neither buyers nor sellers have control. The zone is not generating the momentum it should.
Grinding through. Price spends multiple candles inside the zone, moving sideways or slowly pushing through. Compare this to a valid reaction where price touches the zone and immediately reverses.
No follow-through. Price bounces off the zone briefly, but the bounce stalls. It cannot create a new higher high (at demand) or lower low (at supply). Then it comes back to the zone for another touch.
Break and close beyond. The clearest signal: a candle closes below a demand zone or above a supply zone with a full body through the level. The zone is broken.
Walkthrough: Failed Demand Zone on EUR/USD
You identify a demand zone on the 1-hour EUR/USD chart between 1.0850 and 1.0865. The zone formed after a strong bullish impulse last Tuesday. Price has not returned to it until today.
Price drops to 1.0862 (inside the zone) and forms three small-bodied candles over 3 hours. No strong bullish reaction. No break of structure to the upside on the 15-minute chart. Price drifts lower to 1.0855, still inside the zone, and forms another doji.
Then a large bearish candle closes at 1.0842, below the zone bottom at 1.0850. The demand zone has failed. The resting buy orders that created the zone have been absorbed. The bias flips bearish.
If you had a limit buy order at 1.0860, you got filled and then watched price drop through your stop. The zone failure cost you -1R.
The lesson: watch how price behaves inside the zone before committing. Weak reaction candles are a warning.
Why Zones Fail: Exhaustion and Opposing Pressure
Zones fail for two main reasons, and understanding which one is at play changes how you respond.
Order Exhaustion. Every supply and demand zone exists because unfilled orders were left at that price. When price returns, those orders execute, and the reaction happens. But orders are finite. Each time price returns to the zone, some orders get filled. By the second or third touch, fewer orders remain. The reaction weakens, and eventually the zone breaks.
This is why first-touch zones are the highest probability setups. The orders are fresh and fully loaded. By the third return, you are trading on hope, not structure.
Higher-Timeframe Opposing Pressure. Even a fresh zone can fail if the larger trend is pushing against it. A daily demand zone in a weekly downtrend is fighting the current. The weekly sell pressure can overpower the daily buy orders and push right through.
This is why daily bias matters. If your higher-timeframe narrative is bearish, demand zones on lower timeframes are automatically suspect. They can work, but the probability drops.
The strongest zones have both factors in their favor: fresh (first touch) and aligned with the higher-timeframe trend.
Failed Demand Zone vs Failed Supply Zone
Failed demand and failed supply look like mirror images, but they create different trading opportunities.
Failed Demand Zone. Price reaches a demand zone (expected to bounce up) and breaks through. This means buyers at that level have been overwhelmed. The area that was support is now potential resistance. If price retests the broken demand from below, you can look for short entries.
A broken demand zone often leads to a break of structure on the current timeframe. Watch for the swing low below the demand zone to break, confirming a structural shift from bullish to bearish.
Failed Supply Zone. Price reaches a supply zone (expected to reverse down) and pushes through. Sellers at that level have been overwhelmed. The area that was resistance becomes potential support. If price retests the broken supply from above, you can look for long entries.
Walkthrough: Trading After a Failed Supply Zone
GBP/USD on the 4-hour chart. A supply zone sits between 1.2720 and 1.2740. Price has tested it once before and bounced down. Now it returns for a second touch.
Price enters the zone at 1.2720 and spends 8 hours grinding through it with small candles. Then a strong bullish candle closes at 1.2755, 15 pips above the zone top. The supply zone has failed.
You switch from a bearish bias to a bullish one. You wait for price to pull back to the broken supply zone (now acting as demand) around 1.2730. Price pulls back, creates a market structure shift on the 15-minute chart, and you enter long at 1.2735. Stop at 1.2715 (below the old zone), target at the next swing high at 1.2795.
Risk: 1.2735 minus 1.2715 = 20 pips. Reward: 1.2795 minus 1.2735 = 60 pips. R:R = 60 divided by 20 = 3R.
The zone failure gave you the information. The structural confirmation gave you the entry.
How to Adjust Your Bias After a Failed Reaction
A failed zone is a signal, not just a loss. Here is the adjustment process:
Step 1: Confirm the failure. A wick through the zone is not a failure. You need a body close beyond the zone boundary. On the 1-hour chart, wait for at least one full candle close below a demand zone or above a supply zone.
Step 2: Check for a liquidity sweep. Sometimes price sweeps below a demand zone to grab stop-loss liquidity, then reverses sharply. If you see a sweep followed by an immediate, aggressive reversal with strong candles, the zone may not have failed. It was just tested harder than expected.
The difference: a sweep reverses within 1 to 3 candles with conviction. A failure grinds through with weak candles and no reversal momentum.
Step 3: Flip your bias. If the zone genuinely failed, reverse your directional expectation. A failed demand zone means you should be looking for shorts, not longs. A failed supply zone means you should be looking for longs, not shorts.
Step 4: Identify the new zone. The failed zone itself becomes a point of interest in the opposite direction. A broken demand zone can act as resistance on a retest. A broken supply zone can act as support on a pullback.
Step 5: Wait for confirmation. Do not immediately enter a trade in the new direction. Wait for a structural signal, such as a break of structure or market shift on the lower timeframe, that confirms the new bias. The failed zone tells you where. Structure tells you when.
How EdgeFlo Documents Zone Failures in Your Journal
EdgeFlo's journal records zone outcome for every trade. When you tag a trade as targeting a specific supply or demand zone, you also record whether the zone held or failed. Over time, this builds a dataset of zone performance.
That data answers questions you cannot eyeball. "What percentage of my second-touch demand zones failed?" "Do my zones fail more during New York session?" "Is my win rate higher when I avoid zones that have been tested twice?"
These are the questions that separate traders who guess from traders who know. The zone failure data lives in your journal alongside every other trade variable. When you review it during weekly performance analysis, the patterns become clear.
Your trading plan should include a rule for handling failed zones. Something like: "If price grinds through a zone with 3+ indecisive candles and closes beyond the boundary, flip bias and wait for confirmation on the lower timeframe." Write it down, apply it consistently, and let your journal data prove whether it works.
What causes a supply or demand zone to fail?
How do I know if a zone is failing or just being tested?
Should I trade failed zones or avoid them?
How many touches before a zone is likely to fail?

Turn discipline on.
Every session.
EdgeFlo is the environment serious traders operate inside.
Start 7-Day Trial — $7
Cancel anytime.
No long-term commitment.


Think Different, Trade Different.