

Extreme Demand Zone: The Last Line of Defense
The extreme demand zone at the swing low is where bullish structure lives or dies. If it breaks, the trend flips. Step-by-step identification guide.

Not all demand zones are equal. Some sit in the middle of a swing range, products of minor pullbacks and shallow consolidations. Others sit at the very bottom, at the exact price level where the entire bullish trend was born.
That bottom zone is the extreme demand zone. It is the last place buyers have to show up. If they do, the trend continues. If they do not, everything flips bearish.
Understanding this distinction saves you from treating every zone the same and helps you focus your capital on the one zone that carries the most structural weight.
TL;DR
The extreme demand zone sits at the swing low that caused the most recent break of structure.
It carries the highest probability because it is the final defense for bullish structure.
If price breaks through the extreme zone, the trend shifts bearish. Your bullish bias is wrong.
Always start mapping zones from the extreme, then work inward. The extreme zone is your primary point of interest.
This zone also offers the best R:R because it sits deepest in discount pricing.
What Makes a Demand Zone Extreme
In a bullish swing range, multiple demand zones exist between the swing low and the swing high. Price pulled back several times on the way up, creating smaller zones along the climb. But one zone stands apart: the one at the very bottom.
The extreme demand zone is formed by the candles at the swing low itself. Specifically, look at the last bearish candle (or cluster of candles) right before price launched into the impulsive move that created the break of structure. That candle or cluster is where the most aggressive institutional buying happened.
Why was the buying so aggressive there? Because that low is where the previous bearish momentum was fully absorbed. Sellers pushed as far as they could, ran out of pressure, and buyers stepped in with enough force to break the swing high above. All of that buying energy originated from this single zone.
Non-extreme zones (those formed during minor pullbacks higher in the range) had less structural significance. Price paused there briefly, attracted some orders, but the primary institutional activity happened at the extreme.
Why the Swing Low Is Make or Break
In a bullish market, structure is defined by higher highs and higher lows. The swing low is the most recent "higher low." For the bullish thesis to remain valid, this low must hold.
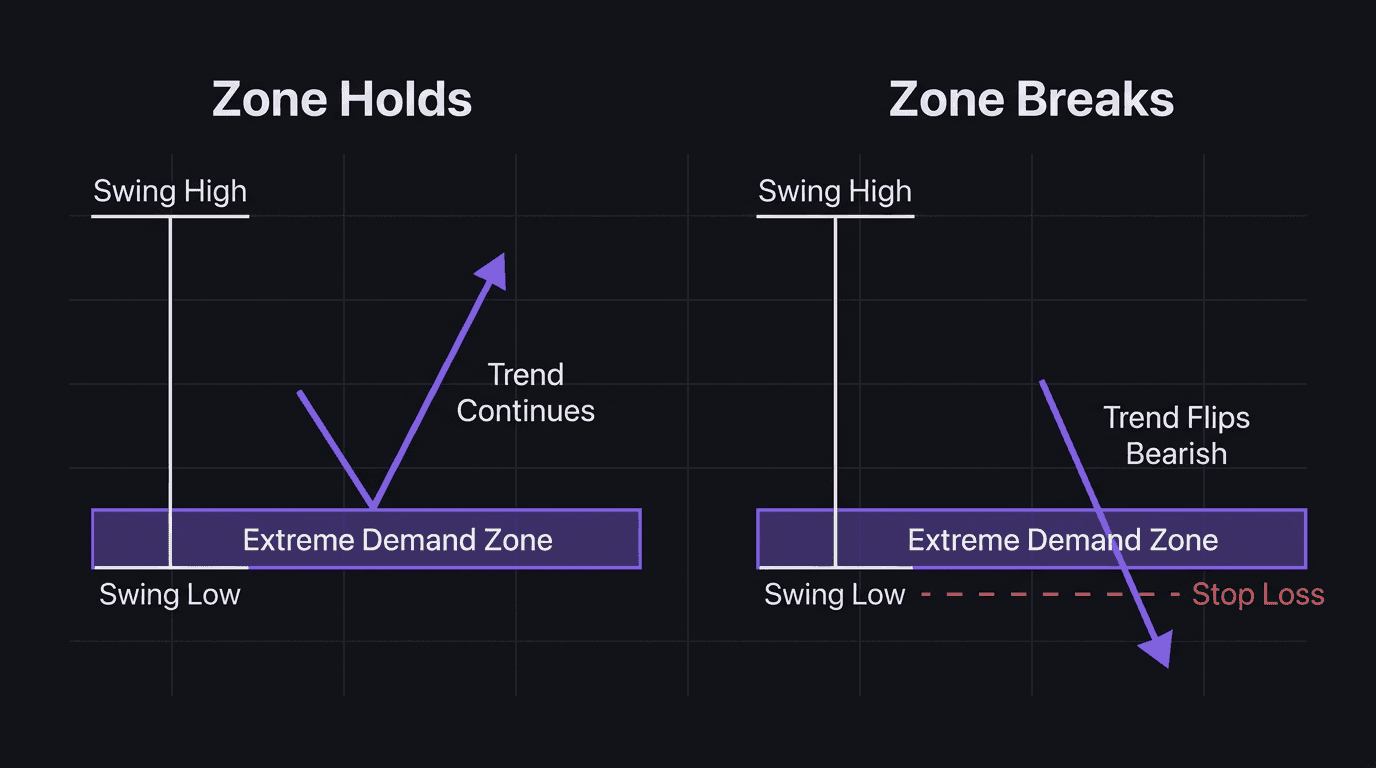
If price returns to the extreme demand zone and bounces, the trend is intact. Buyers defended their turf. The higher-low pattern continues. Price should push for a new higher high.
If price breaks through the zone and closes below the swing low, the structure has shifted. What was a bullish market with higher highs and higher lows is now making a lower low. That is the first signal of a bearish shift.
This binary outcome is what makes the extreme zone so powerful for trading. You are not guessing whether a random level will hold. You are entering at a price point where the outcome defines the next major move. Either the trend continues (you win) or the trend breaks (you get stopped out with a tight loss, because your stop is right below the zone).
Walkthrough: Extreme Zone Holds on AUD/USD
AUD/USD, 4-hour chart. Bullish break of structure when price broke above 0.6650. The swing low that caused this breakout sits at 0.6570. The candles at 0.6570 to 0.6585 form the extreme demand zone: a bearish candle that wicked to 0.6570, followed by a massive bullish candle that launched the breakout.
Price climbs to 0.6720 (new swing high), then begins pulling back. It drops to 0.6640, pauses at a minor demand zone, then continues lower. At 0.6590, price enters the extreme demand zone.
On the 15-minute chart, price sweeps below 0.6570 (grabbing stop-loss liquidity below the swing low), prints a pin bar with displacement, breaks the last lower high at 0.6595, and fails to push lower on the retest.
Entry at 0.6598. Stop below the sweep at 0.6565. Risk: 33 pips. Target at swing high 0.6720. Reward: 122 pips. R:R = 3.7:1.
Price rallied from the extreme zone and hit the swing high within six trading days. The extreme zone held because that is where the real institutional buy orders sat. The minor zone at 0.6640 that price blew through? It did not have the same structural weight.
If This Breaks, the Trend Flips
Here is the flip side, and it is equally important.
Same AUD/USD setup, but this time price enters the extreme zone at 0.6580, shows no rejection on the 15-minute, prints bearish continuation candles, and closes below 0.6565 on the 4-hour chart.
The swing low is broken. The bullish structure is gone. What you had was a higher-low expectation, and the market just made a lower low. The correct response is to cancel any bullish bias and start looking for bearish setups.
This is where your stop loss placement proves its value. If your stop was below the extreme zone (say, at 0.6560), you took a small, defined loss at the exact price that invalidated your trade idea. The structure broke. Your stop was there. You move on.
Traders who do not understand the extreme zone often place stops at arbitrary levels or try to "add to the position" when the zone breaks. That is denial, not trading.
Walkthrough: Finding the Extreme Zone
Here is the step-by-step process to identify the extreme demand zone on any chart.
Find the most recent break of structure on the 4-hour chart. In a bullish trend, this is the last time price broke above a significant swing high.
Trace back to the origin. From the break of structure, scroll left to find the lowest point that initiated the move. This is your swing low.
Mark the candles at the swing low. The extreme demand zone is formed by the last bearish candle (or candle cluster) right before the impulsive bullish move started. Mark from the open of that candle to the low of its wick. That rectangle is your zone.
Check for mitigation. Has price already returned to this zone and bounced? If yes, the zone has been partially mitigated. It may still hold, but its strength is reduced. An unmitigated extreme zone (first touch) is the highest probability setup.
Confirm it sits in discount. Apply your premium-discount tool. The extreme zone should sit below the 50% equilibrium of the swing range. If it does, the R:R math works in your favor.
That is it. No indicators. No oscillators. Just structural logic and zone identification.
How EdgeFlo Tracks Your Zone Selection
Over time, the quality of the zones you trade matters as much as your entry technique. A trader who consistently enters extreme zones will outperform a trader who enters whatever zone is closest, even if both use the same confirmation model.
EdgeFlo's journal lets you tag trades by zone type. After 30 or 40 trades, you can filter by "extreme zone" vs "intermediate zone" and compare the average R, win rate, and drawdown. That data tells you whether your zone selection process is working or whether you are spreading capital too thin across weak levels.
The weekly AI report (Plus) can flag when your zone quality is drifting, highlighting weeks where most entries happened at intermediate zones instead of extreme ones. That visibility keeps your focus where the probability is highest.
What is an extreme demand zone?
Why does the extreme demand zone have the highest probability?
How do I identify the extreme demand zone?
What happens if the extreme demand zone breaks?

Turn discipline on.
Every session.
EdgeFlo is the environment serious traders operate inside.
Start 7-Day Trial — $7
Cancel anytime.
No long-term commitment.


Think Different, Trade Different.