

Double Tops and Bottoms Are Liquidity Traps
Double tops and bottoms are not reversal signals. They are liquidity magnets where banks collect stop losses before the real move. Learn how to trade the reaction.

Every trading textbook teaches the same thing: sell the double top, buy the double bottom. And every year, that advice costs retail traders billions in stopped-out positions.
The problem is not that the patterns are wrong. The patterns are real. The problem is what they actually mean. Double tops and bottoms are not reversal signals. They are neon signs advertising where stop losses are sitting. And institutions can read those signs better than you can.
TL;DR
Double tops and bottoms are liquidity magnets, not reversal signals.
Banks use equal highs and equal lows to locate clustered stop orders.
The real move begins after the sweep, not before it.
Trading the pattern means entering early and getting stopped out.
Your edge comes from waiting for the reaction after the trap springs.
Why Double Tops and Bottoms Attract Liquidity
Think about what happens when a double top forms. Price reaches a high, pulls back, then pushes to the same high again. Every retail trader watching that chart draws the same conclusion: resistance confirmed, time to sell.
So they sell. And where do they place their stop losses? Right above those equal highs. Every single one of them.
Now zoom out. Those stop losses are buy orders waiting to be triggered. When price spikes above the double top, it does not mean the market is breaking out. It means all those buy stops just fired at once, and whoever pushed price up there just got filled at the best possible price for their long positions.
The same thing happens with double bottoms, just in reverse. Traders see equal lows, enter long, and place stops below. Those stops become sell orders. Price dips below, triggers them all, collects the liquidity, and then the real move begins.
This is not a conspiracy. It is basic order flow mechanics. Large positions need liquidity to fill. Double tops and bottoms are the most predictable sources of that liquidity in any market.
How Banks Use These Patterns to Fill Orders
Institutions do not think in patterns. They think in liquidity pools. A double top is not a "sell signal" to a bank. It is a location where predictable retail behavior has stacked sell-side liquidity above a visible level.
Here is how the sequence works on a double bottom:
Price creates a low, pulls back, then returns to the same low.
Retail traders enter long, placing stop losses below the equal lows.
Price drops through those lows, triggering all the stops.
Those triggered stops become market sell orders, providing liquidity for institutions to buy.
Once sufficient orders are filled, price reverses and moves sharply upward.
The spike below the double bottom is not a breakdown. It is a liquidity sweep. And the real buying only happens once that sweep is complete.
Walkthrough: EUR/USD Double Bottom Trap
EUR/USD on the 1-hour chart forms equal lows at 1.0820. Retail traders enter long at 1.0825 with stops at 1.0810. Price drops to 1.0805, triggering all stops. Within the next two candles, price reverses and rallies to 1.0890, a 70-pip move from the sweep low. The traders who bought the double bottom lost 15 pips. The traders who waited for the sweep and entered at 1.0820 after the reversal candle captured up to 70 pips with a tighter stop below 1.0800 (20-pip risk for 70-pip reward, 3.5R).
The Difference Between a Real Reversal and a Liquidity Grab
Not every spike through equal highs or lows is a stop hunt. Sometimes markets genuinely break out. The distinction comes down to what happens after the level is taken.
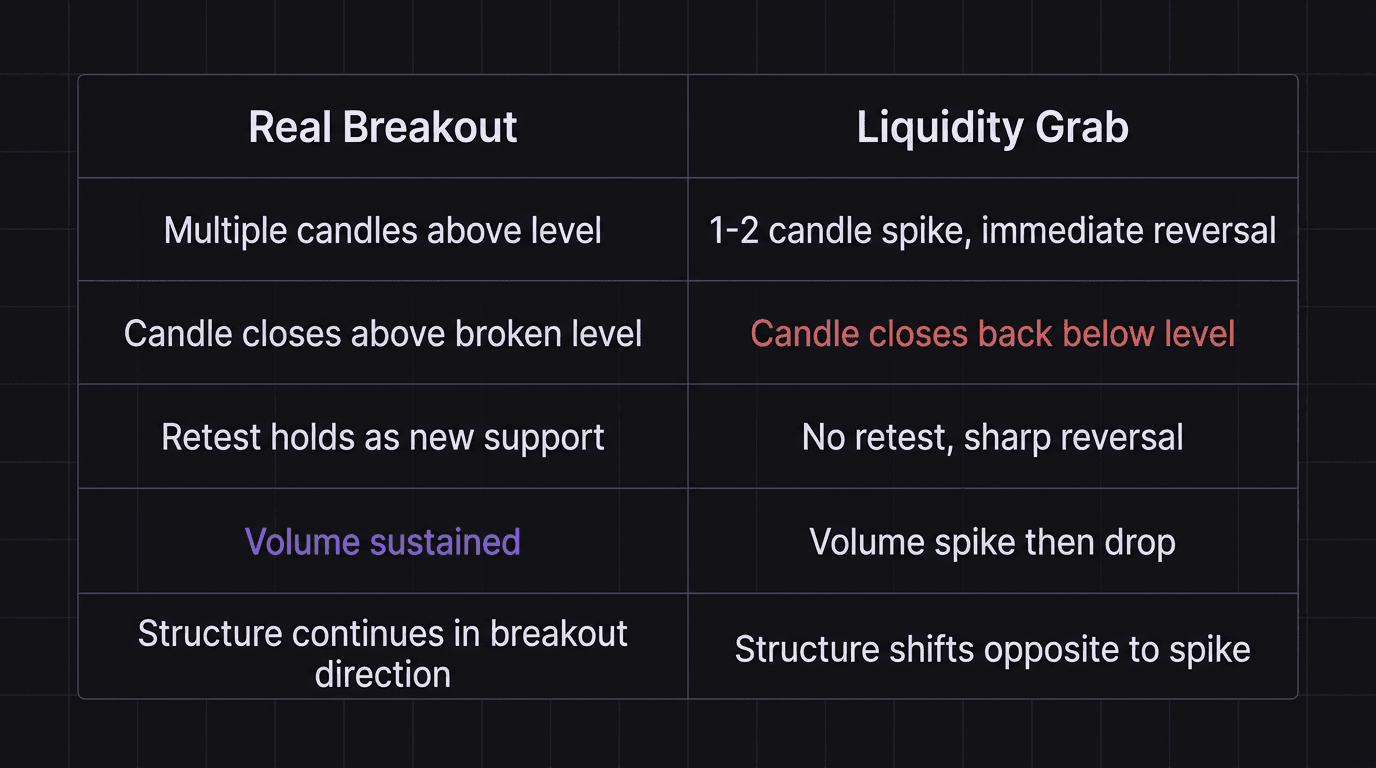
A real breakout shows commitment. Price pushes through, pulls back to retest the level as new support or resistance, and then continues in the breakout direction. Volume stays strong. Structure shifts cleanly.
A liquidity grab looks different. Price spikes through the level aggressively, often on a single candle, then immediately reverses. The candle that breaks through often closes back inside the range. There is no follow-through. The move exists purely to trigger orders, not to establish a new direction.
Here are the tells:
Speed: Liquidity grabs happen fast. One or two candles. Real breakouts build over several candles.
Candle close: If the breakout candle closes back below the level it just broke (for a double top sweep), it was a grab.
Context: Was there a demand or supply zone nearby? If price swept equal lows right into a demand zone, that is institutional interest, not random selling.
Structure after: Does internal structure shift after the sweep? A market structure shift from bearish to bullish after a low sweep confirms the grab was intentional.
How to Trade After the Trap Springs
The money is not in predicting the trap. It is in trading the reaction.
Once you see a liquidity sweep through equal highs or lows, your job changes. You stop looking for the pattern and start looking for the response. There are two approaches: aggressive and conservative.
Aggressive entry: Enter immediately after the sweep candle closes. Your stop goes below the sweep candle low (for a long after a low sweep). This gets you in early but carries the risk that price may sweep deeper before reversing.
Conservative entry: Wait for a market structure shift after the sweep. Price sweeps the lows, reverses, and breaks the most recent lower high on the internal timeframe. This confirms that internal structure has shifted bullish. Then wait for a pullback into the demand zone created by the sweep. Enter on the retest with your stop below the sweep low.
The conservative method gives you a cleaner entry and higher probability, but the aggressive method often captures a larger move. Both work. Pick one that fits your risk tolerance and stick with it.
Walkthrough: A Double Top That Was Not a Sell Signal
GBP/USD on the 15-minute chart prints equal highs at 1.2740. A trader sells at 1.2735 with a stop at 1.2755. Price spikes to 1.2758, stopping them out for a 23-pip loss (including spread). But the spike candle closes at 1.2738, back below the equal highs. A conservative trader waits. Internal structure shifts bearish on the 5-minute chart. Price retests the supply zone at 1.2745 and the trader enters short with a stop at 1.2760. Price drops to 1.2680. That is a 65-pip move on 15 pips of risk, 4.3R.
The retail trader who sold the double top lost. The trader who recognized it as a fake breakout and waited for the sweep profited over four times their risk.
How EdgeFlo Marks Liquidity Zones on Your Chart
Knowing that double tops and bottoms are traps is one thing. Remembering to check for them in the heat of a session is another.
EdgeFlo's FloAI surfaces pattern observations (Plus plan) while you are analyzing, which can flag equal highs and lows forming in real time. Instead of relying on your eyes alone, you get a second check on the levels that matter most. You can override or ignore the flag, but at least you saw it before you placed the trade.
The built-in trading journal also lets you tag trades by setup type. After a few weeks of tagging your double top and double bottom trades, you can pull up your stats and see exactly how often the pattern worked versus how often the sweep happened first. That data replaces guessing with evidence.
Most traders who start tracking this find the same thing: the sweep happens more often than the textbook reversal. Once you see that in your own numbers, you stop fighting the pattern and start trading the reaction.
Are double tops and bottoms reliable reversal patterns?
How do banks use double bottoms to trap traders?
Should I ever trade a double top or double bottom?
What is the difference between a liquidity sweep and a breakout?

Turn discipline on.
Every session.
EdgeFlo is the environment serious traders operate inside.
Start 7-Day Trial — $7
Cancel anytime.
No long-term commitment.


Think Different, Trade Different.