

Direction, Location, Execution: 3 Steps to Every Trade
Every profitable trade follows three steps: direction, location, execution. Learn the exact sequence that eliminates guesswork from your entries.

Every losing streak has the same root cause. You skipped a step.
Not a complicated step. Not some advanced technique buried in a 40-hour course. You skipped one of three basic questions that every profitable trade answers before entry: Who controls price? Where should I enter? When do I pull the trigger?
Most traders jump straight to "when" without answering "who" or "where" first. They see a candlestick pattern, get excited, and click buy. The pattern was real. The context was missing. The loss was predictable.
TL;DR
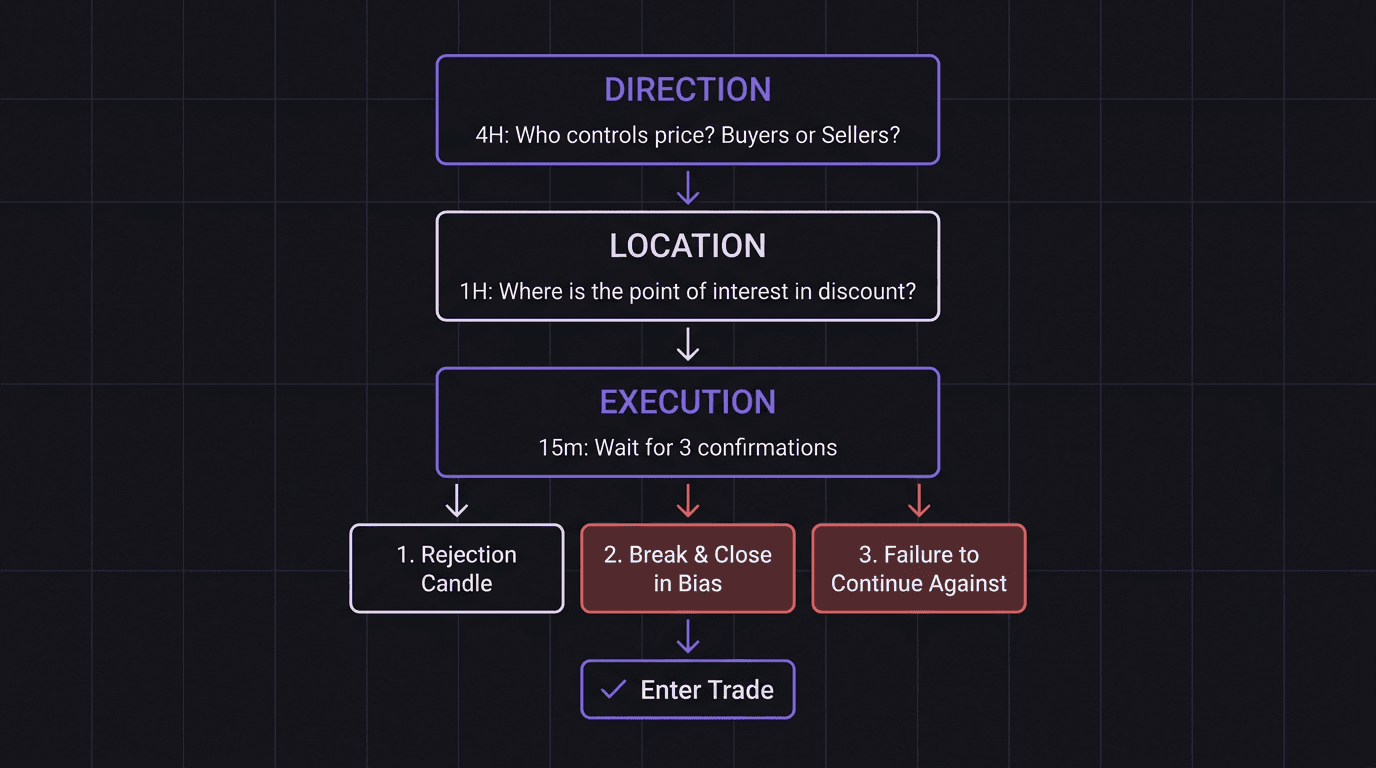
Every trade requires three decisions in order: direction (who controls price), location (where to enter), and execution (when to enter).
Direction comes from the higher timeframe; location from a point of interest in discount pricing; execution from lower timeframe confirmation.
Entering in the middle of nowhere produces terrible risk-to-reward because your stop is too far from structure.
If any of the three steps is missing, skip the trade completely.
This sequence turns price action from overwhelming into boring, repeatable, and profitable.
Step 1: Identify Who Controls Price
Before anything else, open your 4-hour chart and read the structure. The only question at this stage: are buyers or sellers in control?
You answer this by reading swing highs and swing lows. If price is making higher highs and higher lows, buyers control. If price is making lower highs and lower lows, sellers control. That is the entire analysis for step one.
Once you identify the trend, map the most recent break of structure. Find the swing low that caused the breakout and the swing high where price started pulling back. Connect them. That is your swing range, and everything outside of it is noise.
Sound too simple? Good. Step one is supposed to be simple. You are not predicting anything yet. You are observing who won the last battle and choosing to trade alongside them.
Walkthrough: Reading Direction on EUR/USD 4H
Picture EUR/USD on the 4-hour chart. Price has been climbing for two weeks: higher high at 1.0960, pullback to 1.0880, higher high at 1.0990, pullback to 1.0920. The structure is clearly bullish.
The most recent break of structure happened when price took out 1.0960. The swing low that caused that breakout sits at 1.0870. The swing high is 1.0990. That is your 4H swing range: 1.0870 to 1.0990.
Now you know one thing: you want longs. That is all step one gives you. Direction. Nothing more.
Step 2: Find the Best Location to Enter
Now you know the "what" (buy, not sell). The next question is "where."
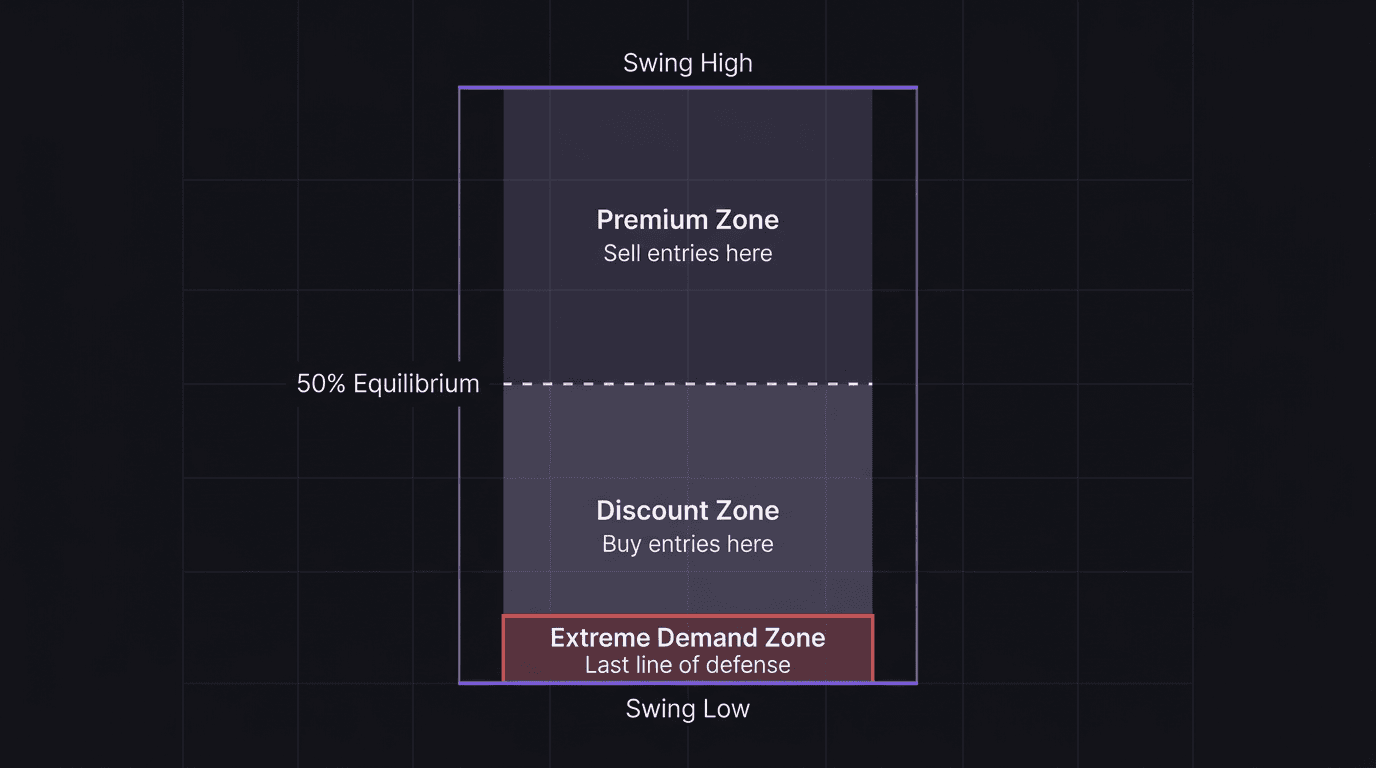
This is where most beginners go wrong. They see bullish structure and immediately start scanning for buy entries wherever price currently sits. But if price is in the premium zone, above the 50% equilibrium level, you are buying at expensive prices with a wide stop and thin reward.
Drop to the 1-hour timeframe. Map your premium and discount using a Fibonacci retracement from the swing low to the swing high. Everything above the 50% level is premium (expensive). Everything below is discount (cheap).
For a buy, you want to enter in the discount zone. Find your demand zones down there. The most extreme demand zone, the one sitting at the very swing low, carries the highest probability because it is the last line of defense for bullish structure. If that zone breaks, the trend flips bearish.
In our EUR/USD example, the swing range runs from 1.0870 to 1.0990. The 50% equilibrium sits at 1.0930. You do not want to buy anything above 1.0930. Your demand zone at 1.0870 to 1.0880 sits deep in the discount zone. That is your location.
Step 3: Wait for Execution Confirmation
You know the direction (bullish). You know the location (demand zone at 1.0870 to 1.0880). Now set an alert and walk away.
This is the hardest part. Price might take hours or days to reach your zone. During that time, you do nothing. No scanning for random entries. No "it looks like it might bounce here." Nothing.
When price finally taps your zone, drop to the 15-minute chart and look for three confirmations:
Strong rejection candle. An engulfing candle or pin bar with displacement showing that buyers stepped in hard.
Break and close in the bullish direction. A candle that closes above the previous bearish candle, confirming buyers have taken short-term control.
Failure to continue lower. Price tries to push down again but cannot create a new low, signaling that selling pressure is exhausted.
Only when all three confirmations appear on your lower timeframe do you enter. Place your stop below the rejection candle's low (the price point that invalidates your bullish idea) and target 3R.
Walkthrough: What Happens Without Confirmation (The Mistake)
Same EUR/USD setup. Price drops to 1.0875, right into your demand zone. You see the first touch and think, "This is it, buyers are stepping in." You buy immediately at 1.0878 with a stop at 1.0860.
But there is no rejection candle yet. No break of the bearish 15-minute structure. Price wicks into the zone, pauses for two candles, then continues dumping to 1.0855. You get stopped out for 18 pips.
Two hours later, price sweeps below 1.0860, prints a massive bullish engulfing candle, breaks the last lower high on the 15-minute, and rallies 120 pips to 1.0990. The setup was right. The zone was right. You just entered before step three gave you permission.
Why This Order Prevents Stupid Trades
The sequence matters because each step filters out bad trades before you reach the next decision.
If direction is unclear (choppy, no structure), you stop at step one. No zone analysis needed. No lower timeframe scanning. You saved yourself 45 minutes of chart staring that would have ended in a forced entry.
If direction is clear but price is in the premium zone with no demand zones in discount, you stop at step two. No execution analysis needed. You wait.
If direction is clear and price reaches your zone but gives zero confirmation on the 15-minute, you stop at step three. The zone was right, but the timing was not. You skip it.
This is how you go from taking 15 trades a week to taking 3, while making more money. The framework forces you to build a mechanical plan instead of reacting to every candle that looks interesting.
Your job as a trader is capital allocation. You decide which trades deserve your money and which ones do not. Trading in the middle of nowhere, without confirmation, without structural alignment, that is not an A+ setup. That is gambling with extra steps.
How EdgeFlo Keeps Your 3-Step Process Visible
Writing down three steps is easy. Following them under pressure is where most traders fail. You know the process, but in the moment, you skip step two because "it's close enough to the zone."
EdgeFlo's Edge plan builder lets you document your three-step criteria and keep it visible next to your chart while you trade. After each trade, the post-trade self-reporting feature asks whether you followed each step, so you build an honest record of when you stuck to the process and when you deviated.
Over time, the journal surfaces patterns. You might notice that every losing week had entries from the premium zone (step two violations) or entries without rejection candles (step three violations). That kind of feedback turns a theoretical framework into a lived discipline.
What are the three steps of direction, location, execution?
Which timeframe do you use for each step?
Why should I not enter when price is in the middle of nowhere?
What happens if price reaches my zone but gives no confirmation?

Turn discipline on.
Every session.
EdgeFlo is the environment serious traders operate inside.
Start 7-Day Trial — $7
Cancel anytime.
No long-term commitment.


Think Different, Trade Different.