

Consolidation Breakout: Enter After the Trap
Most consolidation breakouts fail because traders enter too early. Learn to wait for the liquidity trap, confirm the break, then enter after the fakeout.

You see price stuck in a tight range. Candles overlap, nothing is moving. Then one candle punches through the range high. You enter long. And price immediately reverses, sweeps back into the range, and takes your stop.
Sound familiar? That is the consolidation breakout trap, and it catches traders every single day.
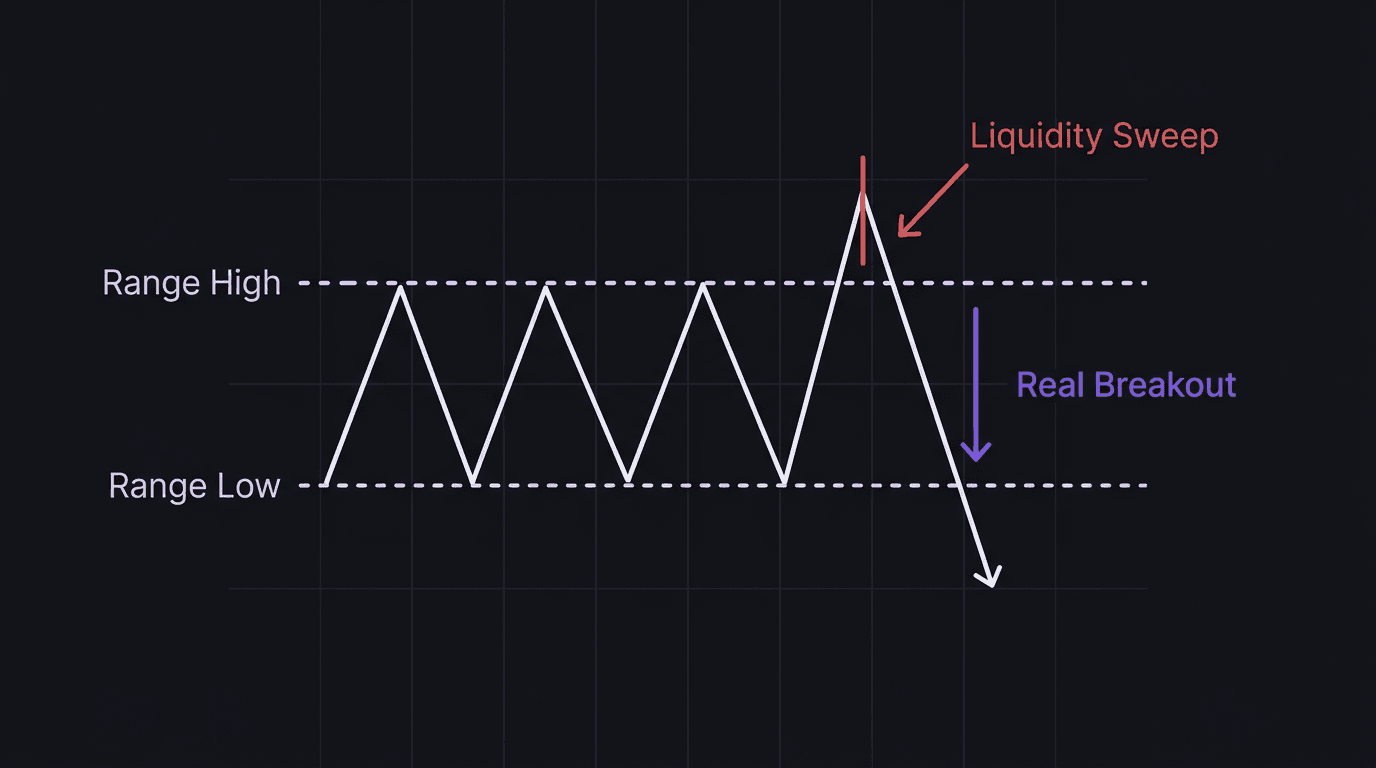
The issue is timing. Real consolidation breakouts do happen. But the first move out of a range is almost always a liquidity sweep, not a genuine breakout. Stops sitting above the range high (or below the range low) get triggered, and then the real move begins, often in the opposite direction.
This article shows you how to read consolidation within order flow, wait for the trap, and enter after the fakeout instead of before it.
TL;DR
The first break of a consolidation range is usually a liquidity sweep, not a real breakout.
Real breakouts require a candle close beyond the range plus a pullback that holds structure.
Consolidation happens when swing order flow stalls and internal structure flips repeatedly within a range.
The highest-probability entry is after the fakeout, once the internal order flow shifts in the breakout direction.
Fear of missing the move causes premature entries. The pullback entry almost always offers better risk-to-reward.
How Consolidation Forms in Order Flow
Consolidation does not just mean "price going sideways." In order flow terms, consolidation is a structural stalemate.
Price is in a bearish swing trend, creating lower highs and lower lows. It pushes down toward a swing low, but the bearish momentum stalls. The weak low does not break. Instead, price bounces off a demand zone and starts creating bullish internal structure.
The internal order flow turns bullish, but it does not have enough power to break the swing lower high either. So price oscillates: bullish internal flow pushes up, hits resistance near the swing high, shifts bearish, drops back to the demand zone near the swing low, then shifts bullish again.
That is your consolidation. A range between a swing high and a swing low where neither buyers nor sellers can force a break of structure.
The range persists because:
From below: A demand zone or cluster of demand zones keeps providing buying pressure.
From above: A supply range or the swing lower high keeps providing selling pressure.
Volume or news catalysts are absent, so neither side gets the fuel needed for a decisive break.
Understanding this structurally prevents you from treating every candle near the range boundary as a trade signal. Most of those candles are just the internal flow ping-ponging between two walls.
The Liquidity Trap: What Actually Happens at Range Boundaries
Here is what happens before the real breakout.
Traders who entered long inside the range place their stops below the range low. Traders who entered short inside the range place their stops above the range high. Those clusters of stops are liquidity.
Before the market can move decisively in one direction, it often sweeps those stops first. Price spikes above the range high (triggering short stops and luring breakout buyers), then reverses hard. Or price dips below the range low (triggering long stops and luring breakdown sellers), then reverses hard.
That sweep is the trap. And the move after the trap is the real one.
This is why buying the first candle above the range costs you money. You are buying someone else's stop loss trigger. The price spike exists to fill orders, not to start a trend.
Walkthrough: The Premature Breakout Entry on USD/JPY
USD/JPY has been consolidating between 149.00 (range low) and 150.00 (range high) on the 4-hour chart for three days. Internal order flow has flipped four times. No swing break in either direction.
A trader watches a bullish 4-hour candle close at 150.15, above the range high. They enter long at 150.15 with a 40-pip stop at 149.75 and a target of 151.00 (85 pips above entry).
Risk: 0.3 lots times $6.70 per pip (USD/JPY at ~149) times 40 pips = approximately $80. Target: 0.3 lots times $6.70 per pip times 85 pips = approximately $171.
Looks like a 2.1R trade. But the next candle? A strong bearish engulfing that drops price to 149.60. The stop at 149.75 gets hit.
What happened: the break above 150.00 was a liquidity sweep. It grabbed the stops of short traders above the range, filled their orders, and then the real sellers stepped in. Price reversed through the range and eventually broke below 149.00 for the actual move.
The trader was right about the consolidation ending. They were wrong about the direction and timing.
The Post-Trap Entry: How to Do It Right
The correct sequence for a consolidation breakout trade has four steps.
Step 1: Identify the range. Mark the swing high and swing low that define the consolidation. You want a range where internal order flow has flipped at least twice, confirming that neither side has control.
Step 2: Wait for the sweep. Price will eventually sweep one side of the range. If price sweeps above the range high and reverses, the real move is likely down. If price sweeps below the range low and reverses, the real move is likely up. The sweep tells you where liquidity was taken.
Step 3: Wait for the internal order flow shift. After the sweep, watch for a market structure shift on the internal timeframe. If price swept above the range and you expect a bearish breakout, wait for the internal order flow to shift bearish (candle close below the last internal higher low). This is your confirmation.
Step 4: Enter on the pullback after the shift. After the internal order flow shifts, price will pull back to a supply range (for a bearish break) or a demand range (for a bullish break). That pullback is your entry.
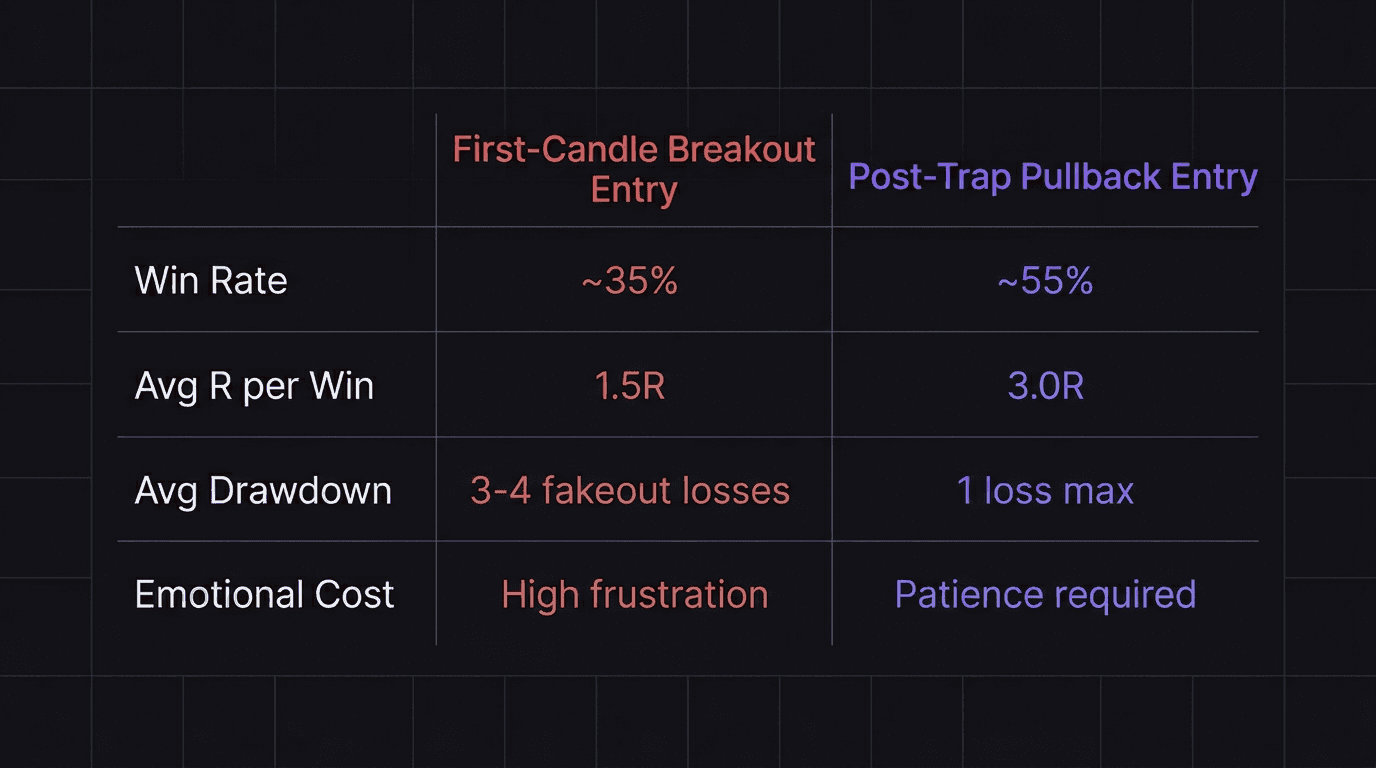
This entry is slower than buying the first candle outside the range. But it has a significantly higher win rate because you have:
Liquidity already taken (the sweep cleared the stops).
Structural confirmation (internal order flow shifted in your direction).
A better risk-to-reward ratio (your stop sits behind the sweep high or low, which is unlikely to be revisited).
Walkthrough: Post-Trap Short on USD/JPY
Same USD/JPY scenario. Price sweeps above 150.00 (the range high) and then reverses. The sweep grabbed shorts' stops. Now price drops back inside the range.
You do not enter yet. You wait.
Price drops and breaks the last internal higher low at 149.60 with a candle close at 149.55. That is the internal order flow shift from bullish to bearish.
Now price pulls back to the supply range created by the sweep (around 149.80 to 150.00). You enter short at 149.85 after seeing a smaller fractal shift bearish on the 15-minute chart.
Stop: 150.20 (above the sweep high). Risk = 35 pips.
Target: 148.50 (below the range low, targeting the next demand zone). Reward = 135 pips.
Reward-to-risk: 135 / 35 = 3.86R.
Risk in dollars at 0.3 lots: 0.3 times $6.70 per pip times 35 pips = approximately $70. Target in dollars: 0.3 times $6.70 per pip times 135 pips = approximately $271.
Math check: $271 / $70 = 3.87R. Clean.
That is what waiting for the trap buys you. The premature entry risked $80 for a loss. The post-trap entry risked $70 with nearly a 4R potential.
Why Traders Enter Too Early (And How to Fix It)
The premature entry problem is psychological, not technical. Most traders understand that false breakouts happen. But when they see that candle punch through the range, fear of missing the move takes over.
"If I wait, I'll miss the whole thing." That thought triggers the entry before confirmation arrives.
Here is the reality: you will miss some breakouts by waiting. Some ranges break and never look back. But the ones you catch with the post-trap entry will have better risk-to-reward, higher probability, and smaller drawdowns. Over 50 trades, the filter pays for itself many times over.
If you backtest this approach, compare two datasets:
All entries on first candle close outside a consolidation range.
All entries on the pullback after a sweep and internal order flow shift.
Dataset 2 will have fewer trades, a higher win rate, and a significantly better average R per trade. The math wins.
Reading the Consolidation Before It Breaks
You do not need to predict which direction the breakout will go. You need to recognize where the consolidation sits within the larger structure and let the sweep tell you.
If the consolidation is high in a bearish swing structure (near the supply range), the odds favor a downside breakout after an upside sweep. The sweep grabs long stops, and then sellers push price through the range low.
If the consolidation is low in a bullish swing structure (near a demand range), the odds favor an upside breakout after a downside sweep. The sweep grabs short stops, and then buyers push price through the range high.
The structure context matters more than the internal back-and-forth inside the range. A consolidation near a swing supply range is more likely to break bearish. A consolidation near a swing demand range is more likely to break bullish.
This is not a guarantee. It is a probability lean, and it keeps you looking for setups in the right direction rather than flipping a coin.
The Patience Tax (And Why It Pays)
Waiting through a consolidation is boring. Waiting for a sweep is nerve-wracking. Waiting for the pullback after the sweep is torturous when you can see the move already happening without you.
But every consolidation breakout strategy comes down to one concept: you either pay the patience tax now (by waiting for confirmation) or you pay the impatience tax later (by taking three fakeout losses before the real move happens).
The patience tax is cheaper. Always.
How EdgeFlo Keeps You Waiting
The hardest part of a consolidation breakout strategy is not the analysis. It is sitting on your hands while the range plays out. EdgeFlo's guardrail system restricts trading after you hit your defined daily loss limit, which prevents the "one more try" spiral that chop and consolidation create. You can override the guardrail, but the restriction makes the decision visible.
Use the Edge plan builder to write your consolidation rules: "Do not enter on first candle outside range. Wait for sweep, internal flow shift, and pullback." Having that rule stored and visible during the session makes it harder to break. Not impossible, just harder.
The auto risk calculator handles the position sizing from your stop distance, so when the real entry arrives after the trap, you execute quickly with correct size instead of fumbling with lot calculations while the pullback is happening.
Why do most consolidation breakouts fail?
How do I confirm a real consolidation breakout?
What is a liquidity trap in a consolidation?
Should I enter a breakout trade on the first candle close outside the range?

Turn discipline on.
Every session.
EdgeFlo is the environment serious traders operate inside.
Start 7-Day Trial — $7
Cancel anytime.
No long-term commitment.


Think Different, Trade Different.