

Consolidation vs Pivot: Draw Better Zones
Two methods for drawing demand zones: consolidation (full pullback) and pivot (origin candle). Learn when each method gives tighter risk and better entries.

There are two ways to draw a supply or demand zone: the consolidation method (mark the entire pullback) and the pivot method (mark just the origin candle). The consolidation method gives you a wider zone that price is more likely to reach. The pivot method gives you a tighter zone with a smaller stop loss and better risk to reward. The right choice depends on your trading style and how much confirmation you need.
Most supply and demand content online shows one method without explaining the tradeoff. That leaves traders drawing zones inconsistently, sometimes wide, sometimes tight, never knowing why their stop losses are too big or their entries keep getting missed.
TL;DR
The consolidation method draws the full pullback range (high to low) before the impulse move. Wider zone, more likely to fill, bigger stop loss.
The pivot method draws only the origin candle at the extreme of the pullback. Tighter zone, better R:R, sometimes price does not reach it.
Both methods identify the same institutional order area. The difference is how much of that area you include.
Pick one method, backtest it, and stay consistent.
The pivot method works best when combined with pullback confirmation on the lower timeframe.
What Both Methods Have in Common
Before diving into the differences, understand what you are actually looking for. Both methods identify the same thing: the origin point of an impulse move that broke market structure.
In an uptrend, price makes higher highs and higher lows. When price pulls back and then pushes aggressively past the previous swing high, that push required serious buying power. Retail traders alone do not generate the energy to break structure. Institutions loaded orders during the pullback, and that pullback is where your zone lives.
Both methods agree on this. They just disagree on how much of the pullback to include in the box.
The Consolidation Method
The consolidation method takes the entire pullback before the impulse and draws a rectangle from its highest point to its lowest point. Every candle in the pullback falls inside the zone.
How to draw it:
Identify the impulse move that broke the previous swing high (for demand) or swing low (for supply).
Find the pullback that came immediately before that impulse.
Draw a rectangle from the high of the pullback to the low of the pullback.
That entire range is your demand or supply zone.
Advantages:
Price almost always reaches the zone because it is wide. You rarely miss a fill.
More forgiving on entry timing. If price dips into any part of the zone, you are in the trade.
Easier for beginners because there is less precision required.
Disadvantages:
Your stop loss sits below the entire zone, which means it is wider. On a zone that spans 40 pips, your stop loss might be 45 pips below your entry.
Wider stop loss means smaller position size (to keep risk at 1%) and lower R:R on the same take profit target.
Price can enter the top of the zone, drop through the middle, and trigger your entry, then continue dropping to the bottom before reversing. That drawdown is uncomfortable even if the trade eventually wins.
Walkthrough: Consolidation Method on EUR/USD
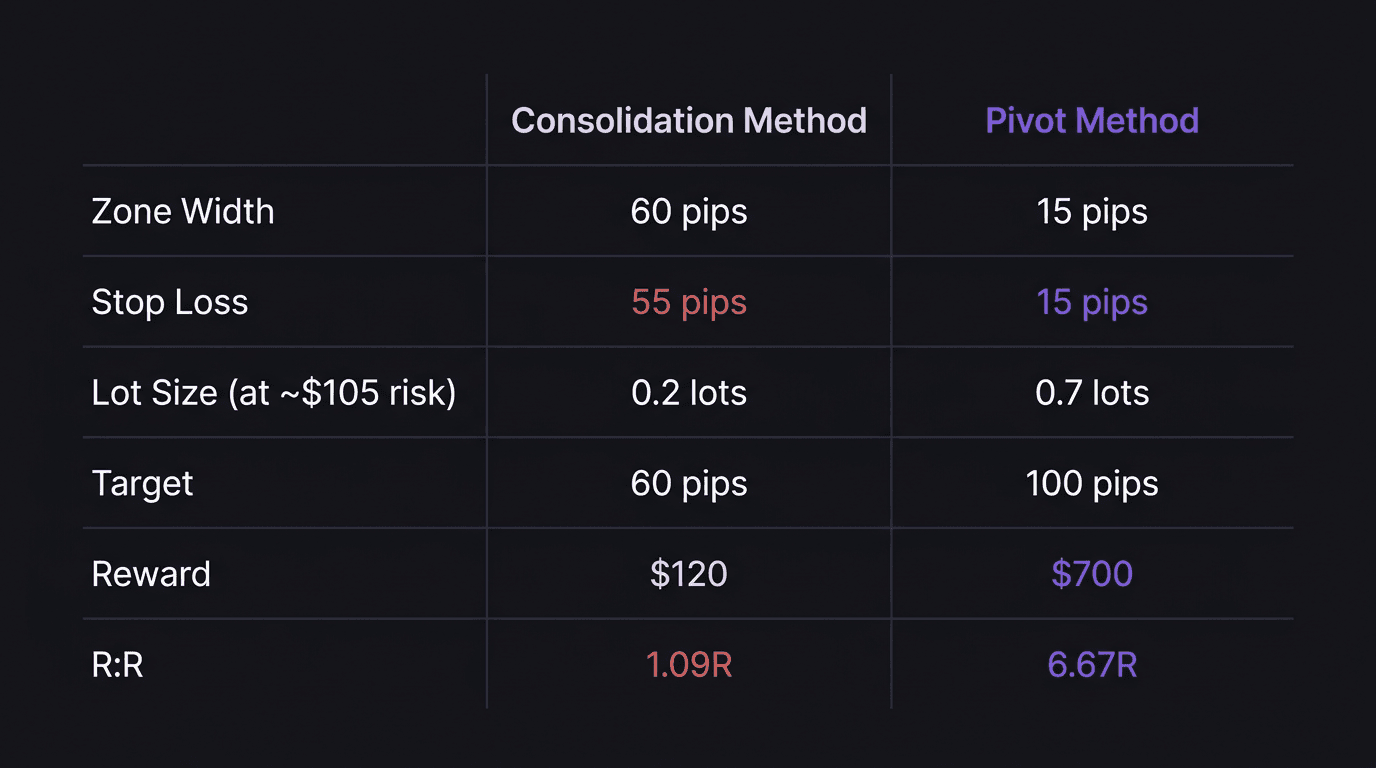
EUR/USD is in an uptrend on the 1-hour chart. Price made a high at 1.0960, then pulled back. The pullback consisted of four candles, ranging from a high of 1.0940 to a low of 1.0880. Then price launched upward and broke 1.0960, making a new high at 1.0990.
You draw the consolidation zone from 1.0940 (pullback high) to 1.0880 (pullback low). That is a 60-pip zone.
Price returns. You enter a buy when price touches 1.0930 (inside the zone). Stop loss goes below the zone at 1.0875, which is 55 pips from entry. At 0.2 standard lots ($2 per pip), risk is 55 pips times $2, which equals $110.
Take profit at the recent high of 1.0990, which is 60 pips from entry. Reward is 60 pips times $2, which equals $120. That is a 1.09R trade. Barely above breakeven on a risk-to-reward basis.
That 1.09R is below the 2R minimum. You would either need to skip this trade, find a deeper entry within the zone, or extend your take profit target. This is the core problem with the consolidation method: wide zones compress your reward ratio.
The Pivot Method
The pivot method skips the entire pullback range and focuses on one thing: the origin candle. This is the single candle at the very bottom of the pullback (for demand) or the very top (for supply) that initiated the impulse move.
How to draw it:
Same first step. Identify the impulse that broke structure.
Trace the impulse backward to its very first candle.
Draw a rectangle from that candle's high to its low. That is your zone.
The pivot candle is the last candle before price reversed direction and started the impulse. In a demand scenario, it is the lowest candle in the pullback. In a supply scenario, it is the highest candle before the drop.
Advantages:
Much tighter zone, often 10 to 20 pips instead of 40 to 60.
Tighter stop loss means better risk to reward on the same target.
Allows larger position size (within the same 1% risk) because fewer pips are at risk.
Disadvantages:
Price sometimes reverses inside the wider consolidation area but never reaches the pivot candle. You miss the trade entirely.
Requires more precision in identifying the correct origin candle. Pick the wrong one and your zone is in the wrong place.
Not as forgiving for beginners who are still learning to read candle structure.
Walkthrough: Pivot Method on the Same EUR/USD Setup
Same setup. EUR/USD pulled back from 1.0960. The pullback ranged from 1.0940 down to 1.0880. But the pivot candle (the lowest candle that started the reversal) had a high of 1.0895 and a low of 1.0880.
You draw the pivot zone from 1.0895 to 1.0880. That is a 15-pip zone.
Price returns. You enter a buy at 1.0890 (inside the pivot zone). Stop loss at 1.0875, which is 15 pips from entry. At 0.7 standard lots ($7 per pip), risk is 15 pips times $7, which equals $105.
Take profit at 1.0990, which is 100 pips from entry. Reward is 100 pips times $7, which equals $700. That is a 6.67R trade.
Same setup, same direction, same risk budget (around $105 to $110). The consolidation method gave 1.09R. The pivot method gave 6.67R. The difference is entirely in zone width and entry precision.
When to Use Each Method
The pivot method is not always better. Here is how to decide.
Use the consolidation method when:
You are still learning to identify demand and supply zones. The wider zone is more forgiving while you build pattern recognition.
The pullback has very small candles with overlapping bodies, making it hard to identify a single origin candle.
You prefer higher fill rates over higher R:R. Some traders value consistency over home runs.
Use the pivot method when:
You want the best possible risk to reward on your entries.
The pullback has a clear origin candle with a distinct body and wick that stands out from the surrounding candles.
You are comfortable missing some trades in exchange for better quality entries when they do fill.
You are trading a pullback strategy on lower timeframes where precision matters more than on swing trades.
The hybrid approach: Some traders use both. They draw the consolidation zone to identify the general area, then draw the pivot zone inside it for the actual entry. If price reaches the consolidation zone but not the pivot zone, they watch for lower timeframe confirmation before entering. If price reaches the pivot zone, they enter directly.
The One Rule That Applies to Both
Regardless of which method you choose, the zone only counts if the impulse move that followed it broke structure. A pullback followed by a weak push that fails to take out the previous swing high is not a valid demand zone. It is just a pullback that went nowhere.
The impulse must prove that institutional money was involved. That proof is the structural break. No break, no zone.
Pick your method, stay consistent, and backtest at least 30 to 50 examples before trading it live. The data will tell you which method fits your pairs, timeframes, and risk tolerance better than any article can.
How EdgeFlo Helps You Stay Consistent
EdgeFlo's Edge feature lets you define, document, and store your zone-drawing rules. You write down whether you use the consolidation method, the pivot method, or a hybrid, and that documentation stays visible during your trading sessions. No more switching between methods based on how you feel that day.
After each trade, EdgeFlo's journal captures your entry, stop, and result so you can review which method is actually performing better in your data. Over 30 or 50 trades, the numbers speak clearly. That feedback loop is what separates traders who improve from traders who keep guessing.
What is the consolidation method for drawing zones?
What is the pivot method for drawing zones?
Which method gives better risk to reward?
Can I use both methods on the same chart?

Turn discipline on.
Every session.
EdgeFlo is the environment serious traders operate inside.
Start 7-Day Trial — $7
Cancel anytime.
No long-term commitment.


Think Different, Trade Different.