

Bearish Order Flow: Map Sellers Before You Short
Bearish order flow means mapping sellers before shorting. Learn to identify bearish BOS, pullback phases, and where to plan short entries with structure.

Selling into a downtrend sounds simple. Price is going down; you want to go down with it. But most short trades fail even when the trend is clearly bearish. The reason is timing.
Bearish order flow has phases. There is the impulse phase where sellers push price lower, the pullback phase where internal buying pressure temporarily takes over, and the continuation phase where sellers regain control. If you short during the pullback phase, you are fighting temporary buyers, and they will push price against you before the trend resumes.
This article maps out exactly how bearish order flow works, where to plan your short entries, and what to document in your trading plan so you execute with structure instead of gut feeling.
TL;DR
Bearish order flow creates lower highs and lower lows at the swing level, with bullish pullbacks in between.
The bullish pullback is internal order flow facilitating the swing pullback into the supply range.
Do not short immediately when price enters the supply range. Wait for the internal order flow to shift bearish first.
The highest-probability short entry is after a market shift confirms bearish internal flow, on the pullback to the new supply range.
Document the bearish entry checklist in your trading plan so it runs mechanically under pressure.
The Anatomy of a Bearish Swing
Every bearish swing leg follows the same three-phase pattern.
Phase 1: Impulse. Price pushes down and breaks past the last weak low, creating a bearish break of structure. This establishes a new strong swing high and a new weak swing low. Sellers are dominant, and the supply range (from the swing high to the pre-break swing low) is your key zone for future entries.
Phase 2: Pullback. After the break, price reverses direction temporarily. The internal order flow turns bullish. Price creates higher highs and higher lows as it climbs back toward the supply range. This is not a reversal. It is the market's mechanism for returning to the zone where unfilled sell orders are waiting.
Phase 3: Continuation. Once price reaches the supply range and the sell orders are mitigated, the internal order flow shifts back to bearish. Price resumes the downtrend, targeting the next weak low.
The mistake 90% of traders make is entering their short in Phase 2. They see price reach the supply range and think, "Sellers are here. I should short now." But Phase 2 is the buyers' territory. Until the internal structure shifts, buying pressure can push price higher than expected, past the supply range, even past the last swing lower high.
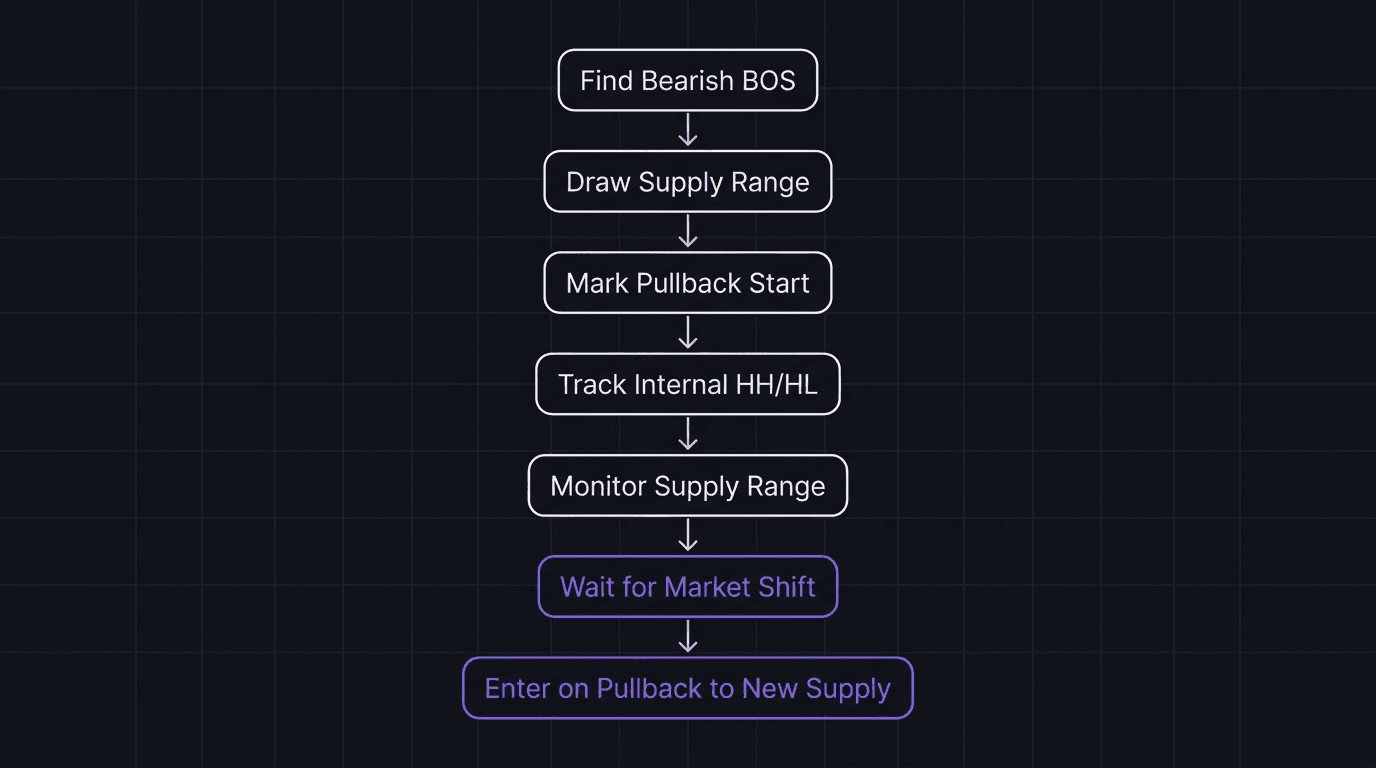
Mapping Bearish Order Flow Step by Step
Here is the exact process to map bearish order flow from a blank chart.
Step 1: Find the bearish BOS. Look for the candle that closed below the last weak low. That break defines your swing range. Mark the strong swing high above it and the newly broken weak low below.
Step 2: Draw the supply range. From the strong swing high down to the swing low before the break, drag it across to where price broke structure. This is the zone where sellers left unfilled orders.
Step 3: Mark the pullback start. Once price begins moving up after the BOS, find the first significant higher low. That marks the beginning of the internal bullish order flow.
Step 4: Track internal structure. Map the higher highs and higher lows within the pullback. Each internal BOS to the upside confirms the pullback is still active.
Step 5: Monitor the supply range. As price approaches the supply range, start watching for the internal shift. The closer price gets to the supply range (especially the 50% equilibrium or the extreme end), the higher the probability of a bearish shift.
Step 6: Wait for the market shift. A candle closes below the last internal higher low. That is your confirmation. Draw the new bearish supply range from the high that led to the internal break.
Step 7: Enter on the pullback to the new supply range. After the market shift, price will pull back to the supply range created by the shift. That pullback is your entry point.
The "Too Early" Short: Why It Fails
Here is the exact scenario that burns traders.
The swing order flow is bearish. Price has made a clean bearish BOS. The supply range is clearly marked between, say, 1.0930 and 1.0960 on EUR/USD. Price starts pulling back into that zone.
A candle enters the supply range. A trader enters short at 1.0940 with a stop at 1.0975 (35 pips) and a target at 1.0850 (90 pips).
Risk: 0.5 lots times $10 per pip times 35 pips = $175. Target: 0.5 lots times $10 per pip times 90 pips = $450.
On paper: 2.57R. Excellent.
But the internal order flow is still bullish. Price is still creating higher highs and higher lows. The bullish internal structure has not shifted yet.
What happens: price pushes through the supply range, reaches 1.0965 (still within the zone), then pulls back slightly and creates another higher low inside the range. Then it pushes to 1.0980, taking out the trader's stop at 1.0975.
The trader was right about the trend, the zone, and the direction. They were wrong about the timing. They shorted in Phase 2 when they should have waited for Phase 3.
Walkthrough: The Correct Bearish Entry
Same chart. Same supply range (1.0930 to 1.0960). Price enters the supply range and pushes up to 1.0955. A new internal higher high.
You do not short. You wait.
Price drops from 1.0955 to 1.0920, breaking below the last internal higher low at 1.0925. That candle close below 1.0925 is the market shift. Internal order flow has flipped from bullish to bearish.
Now you draw the new supply range: from the internal high at 1.0955 down to the break point, extended right.
Price pulls back to 1.0940 (inside the new supply range). You see a fractal shift bearish on the 15-minute chart. You enter short at 1.0940.
Stop: 1.0960 (above the internal high that created the shift). Risk = 20 pips.
Target: 1.0850 (the weak swing low). Reward = 90 pips.
Reward-to-risk: 90 / 20 = 4.5R.
Risk in dollars at 0.5 lots: 0.5 times $10 per pip times 20 pips = $100. Target in dollars: 0.5 times $10 per pip times 90 pips = $450.
Math check: $450 / $100 = 4.5R. Correct.
By waiting for the internal shift, the stop moved from 35 pips to 20 pips, and the reward-to-risk jumped from 2.57R to 4.5R. Same zone, same trend, much better entry.
Building the Bearish Entry Checklist
Trading bearish order flow without a written checklist means relying on memory under pressure. Memory fails when you are watching your third consecutive pullback hit the supply range and you "just know" it is going to drop.
Write this checklist into your trading playbook or use a pre-trade checklist format:
Swing order flow is bearish? (Price below the last strong swing high, creating lower highs and lower lows.) Yes or no.
Supply range identified? (Mapped from the swing high to the pre-BOS swing low.) Yes or no.
Price has entered the supply range? Yes or no.
Internal order flow has shifted bearish? (Candle close below the last internal higher low.) Yes or no.
New supply range drawn? (From the internal high that led to the shift.) Yes or no.
Price has pulled back to the new supply range? Yes or no.
Lower timeframe fractal shift confirms? (Optional but increases probability.) Yes or no.
If any of items 1 through 6 is "no," do not enter. Write this into your mechanical trading plan so it is not a suggestion. It is a rule.
When the Bearish Trend Stalls
Not every bearish swing leg breaks the next weak low. Sometimes price consolidates inside the range, and the internal order flow flips bullish again.
This happens when:
There is not enough momentum (weak news, low volume session) to push past the swing low.
A demand zone from the left side of the chart provides strong support.
The bearish order flow on the higher timeframe is losing steam.
When the internal order flow shifts bullish inside the range (price breaks the last internal lower high), your bearish continuation thesis is weakened. It does not mean the trend is over. Swing order flow can still be bearish. But the internal environment no longer supports shorts.
In this case, step aside. Wait for a new internal shift bearish, or wait for the swing structure itself to change (which would mean a full trend reversal).
The worst thing you can do is keep shorting during a bullish internal shift because "the trend is bearish." The trend might be bearish on the swing level, but the internal buyers will stop you out on every entry until they exhaust themselves.
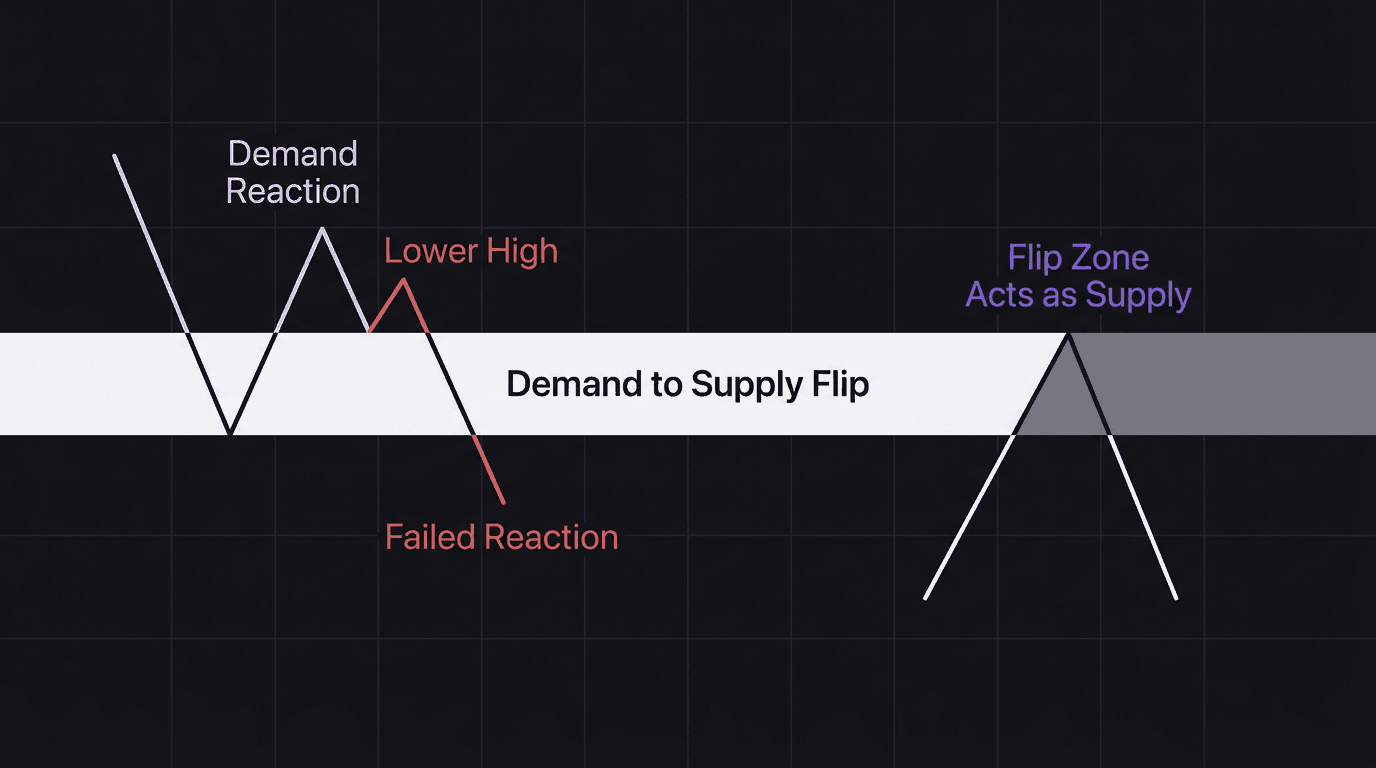
The Demand-to-Supply Flip Zone
One of the most powerful setups in bearish order flow is the flip zone.
Here is how it forms: during the bullish pullback, price reacts from a demand zone (bounces up). But instead of continuing higher and breaking the last internal high, price creates a lower high and drops. The demand zone failed.
That failed demand zone becomes a supply zone. Price had buyers there, they tried, and they lost. Now the market remembers that level as a point of failure. When price returns to that zone later, sellers use it as resistance.
Look for flip zones right at the market shift point. The demand zone that was supposed to fuel the next higher high but failed is now your supply zone for the bearish continuation. Entries from flip zones are among the cleanest in order flow trading because you have structural proof that buyers already tried and failed at that level.
How to Look Left Without Getting Lost
Bearish order flow analysis requires you to check the left side of the chart constantly. Where are the unmitigated demand zones that might cause a pullback? Where are the flip zones? Where is the extreme supply range?
But looking left creates a problem: you end up with fifteen zones marked and no clarity on which ones matter right now.
The rule: only track zones within the current market structure range. If price is trading between the last internal lower high and the last internal break of structure, only mark supply and demand zones within that range. Zones from three swing legs ago do not help you.
Focus on what price is doing right now. Map the current internal structure, the nearest unmitigated zones, and the boundary levels. Delete everything else. Clean charts produce clear decisions.
How EdgeFlo Supports Your Short Entries
Documenting a bearish entry checklist is one thing. Having it visible during execution is another. EdgeFlo's Edge plan builder lets you store your checklist as your active trading plan. It sits next to your chart during the session, not buried in a notebook you forgot to open.
After each trade, you can self-report whether you followed the checklist. Over time, that data shows you whether your bearish entries are disciplined or whether you are still entering in Phase 2 when you should be waiting for Phase 3. The Edge plan does not enforce your rules in real time, but it creates a feedback loop: document, execute, report, review.
That feedback loop is what turns a written plan into a practiced skill.
The Edge Brief
Receive Insights on trading psychology, discipline, and the behavioral patterns that create consistent traders from our Founder and the EdgeFlo team, delivered to your inbox.
Think different. Trade different.
What is bearish order flow?
When should I enter a short trade in bearish order flow?
Why do short trades fail even in a bearish market?
How do I know the bearish trend is over?

Turn discipline on.
Every session.
EdgeFlo is the environment serious traders operate inside.
Start 7-Day Trial — $7
Cancel anytime.
No long-term commitment.


Think Different, Trade Different.