

How Banks Hunt Your Stop Loss (And How to Avoid It)
Banks need your stop loss orders to fill large positions. Learn the stop hunting mechanic, why swing lows are targets, and how to place stops that survive.

Banks need your stop loss orders to fill their massive positions. When smart money wants to buy millions in EUR/USD, they need an equal amount of sell orders on the other side. The most predictable source of those sell orders? Retail stop losses clustered below swing lows. Understanding this mechanic is the difference between being the liquidity and trading with the institutions that take it.
Institutions need large pools of opposing orders to fill their positions without slippage.
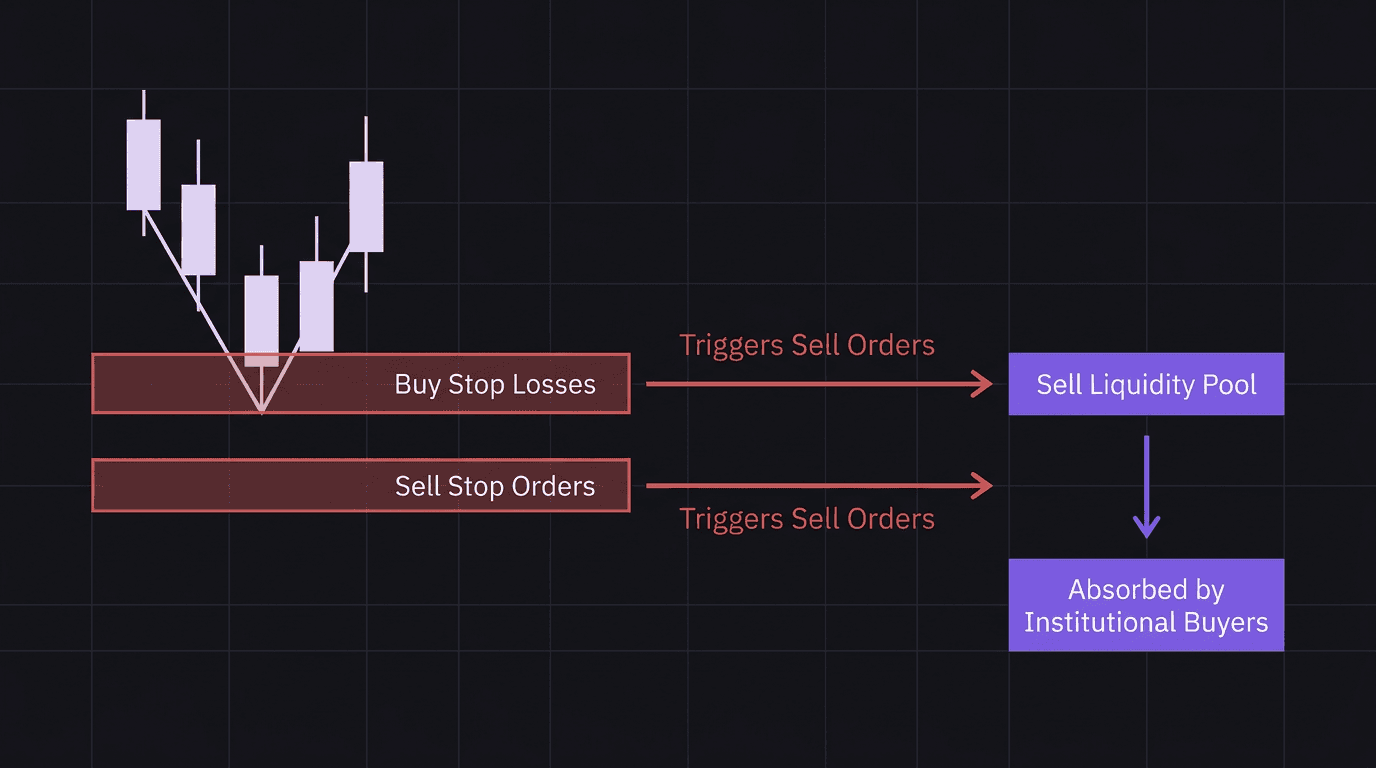
Retail stop losses below swing lows are the most predictable source of sell liquidity.
When your buy stop triggers, it becomes a sell order that feeds institutional buying.
Bearish traders also place sell stops below lows, adding even more sell liquidity to the same zone.
Place stops beyond the liquidity cluster, not at the obvious level everyone else uses.
Why Smart Money Needs Your Stop Loss
Every buy order needs a sell order. This is not theory. It is a mechanical requirement of how markets work. You cannot buy unless someone sells to you at that price.
When you trade a $10,000 position, finding a counterparty takes milliseconds. The market barely notices. But when a bank needs to fill a $50 million buy order, the math changes completely. There are not enough natural sellers at one price level to absorb that kind of size. The order would push price up against them as they fill through increasingly expensive ask levels.
So institutions get creative. They look for areas where large clusters of sell orders are already sitting, waiting to be triggered. And the most reliable source of resting sell orders in the market is retail stop losses.
Think about it from their perspective. Where do most retail traders place their stop loss on a buy trade? Just below the most recent swing low. It is the first thing every trading course teaches. That makes it the most predictable stop location in the market.
The Swing Low Trap Explained
Picture a clear uptrend. Price has been making higher highs and higher lows. The most recent swing low sits at 1.0820. Thousands of retail traders are long, and most of them have their stop loss sitting 5 to 10 pips below 1.0820.
But that is only half the picture. Bearish traders are also watching that same swing low. They have sell stop orders placed below 1.0820, betting that if price breaks that level, the uptrend is over and a downtrend begins.
Now look at what sits below 1.0820: a massive pool of sell orders from both sides. Bullish traders with protective stop losses (which execute as sell orders when triggered) and bearish traders with sell stop entries. All clustered in the same 10 to 15 pip zone.
This is where liquidity hides on the chart. Not in some mysterious location. Right below the obvious swing point that every retail trader marks.
Walkthrough: The swing low trap on GBP/USD. GBP/USD has been trending up on the 1H chart. The most recent swing low is at 1.2640. Retail buyers have stops at 1.2635 and 1.2630. Bearish traders have sell stop entries at 1.2638 and 1.2635. Price suddenly dips to 1.2628, triggering every order in that 12-pip zone. The sell orders flood the market. Institutions absorb all that selling to fill their buy positions. Price immediately reverses and rallies 60 pips to 1.2700. The traders who got stopped out watch in disbelief as the market moves exactly where they expected, just without them on board.
Sound familiar? If you have ever been stopped out at the exact low before a massive reversal, you were not unlucky. You were the liquidity.
What Happens When Your Stop Gets Hit
This is the part most traders do not think about. When your buy trade stop loss triggers, your position closes. Closing a buy position means executing a sell order. Your broker does not care about your feelings. It sends a market sell order.
That sell order goes into the market. And who is waiting to buy it? The institution that needed sell liquidity to fill their massive buy position.
Your loss is their entry. Your sell order fuels their buy. The mechanic is straightforward:
You buy EUR/USD at 1.0860 with a stop at 1.0818 (below the swing low at 1.0820).
Price drops to 1.0815, triggering your stop.
Your broker executes a sell order at 1.0815.
That sell order (along with thousands of others) provides the liquidity for institutional buyers.
Price reverses and pushes to 1.0920.
The same thing happens with bearish sell stops. When a sell stop triggers, the trader enters a short position (a sell). But the execution of that sell stop also adds sell liquidity to the market at that exact moment.
Both types of orders, protective stops and entry stops, create the same outcome: a flood of sell orders at a predictable price level. Institutions know this. They wait for it. They trade with it, not against it.
How to Place Stops That Survive Hunts
You cannot eliminate stop hunts. They are a permanent feature of how markets work. But you can stop placing your stop loss exactly where the institutions are looking for it.
Rule 1: Add a buffer past the liquidity zone. If the swing low is at 1.0820, every other retail trader has their stop between 1.0810 and 1.0820. Place yours at 1.0800 or lower. The extra 10 to 20 pips of buffer means you survive the liquidity sweep that takes out the tight stops.
Rule 2: Use structure, not round numbers. Instead of placing your stop "10 pips below the low," look at the next structural level below. Is there an order block or demand zone at 1.0790? Place your stop below that. Structure-based stops survive hunts better than arbitrary pip counts.
Rule 3: Accept the trade-off. Wider stops mean either smaller position sizes (to keep risk per trade the same) or larger potential losses per trade. This is not a flaw. It is the cost of not being the liquidity.
Walkthrough: Two traders, same setup, different outcomes. Trader A buys EUR/USD at 1.0860 with a stop at 1.0818. Swing low is at 1.0820. Trader B buys at the same price but places the stop at 1.0795, below the demand zone at 1.0800. Price sweeps down to 1.0810, triggering Trader A's stop. Trader A loses 42 pips. Price reverses from the demand zone and pushes to 1.0940. Trader B rides the move for 80 pips. Same trade idea. Same direction. The only difference was stop loss placement relative to the liquidity zone.
The price of a wider stop is worth paying when the alternative is being stopped out at the exact low and watching price run without you. Every. Single. Time.
How EdgeFlo Keeps Risk Visible at Entry
The practical challenge with wider stops is position sizing. If your stop is 65 pips wide instead of 42, you need to reduce your lot size to keep dollar risk the same. Doing that math under pressure, with a chart moving in front of you, is where mistakes happen.
EdgeFlo's auto risk calculator handles this before you place the trade. You set your risk percentage, your stop distance, and the calculator shows your exact lot size and dollar exposure. No mental math. No guessing. You see the risk before you commit.
That visibility changes behavior. When you can see that a 65-pip stop at 0.15 lots keeps you within your 1% rule, you stop hesitating. You stop tightening the stop to "save" risk and accidentally putting it right where the liquidity cluster sits. The calculator does not make the decision for you. It makes the decision clear so you can make it confidently.
Do banks actually hunt stop losses?
Where do most stop losses cluster in forex?
How do I avoid getting stop hunted?
What happens to my buy order when my stop loss triggers?

Turn discipline on.
Every session.
EdgeFlo is the environment serious traders operate inside.
Start 7-Day Trial — $7
Cancel anytime.
No long-term commitment.


Think Different, Trade Different.