

How Inducements Bait You Into Bad Trades
Inducements are tiny structure breaks that bait early entries before the real move reverses. Learn the mechanics and how to filter inducements from real breakouts.

You found a clean demand zone. Price pulled back to it. You entered long. And within three candles, your stop got clipped before price rocketed in the exact direction you predicted.
Sound familiar? That was not bad luck. That was an inducement.
Inducements are one of the most effective tools institutions use to generate the liquidity they need for large positions. And until you learn to recognize them, you will keep providing that liquidity with your stop losses.
TL;DR
Inducements are tiny, fake breaks designed to trigger early entries before the real move.
They look like breakouts or reversals, but they reverse almost immediately.
The stop losses from baited traders become the fuel for the real institutional move.
Never enter on the first touch of a zone without checking for inducement potential.
Wait for the sweep to finish and trade the reaction, not the bait.
What an Inducement Looks Like on a Chart
An inducement is a small, controlled break of structure that exists solely to trap early entries. It shows up as a minor swing low violation during a pullback, a tiny wick below a demand zone, or a brief push above resistance before the real move reverses.
Here is the typical sequence on a bullish setup:
Price is in an uptrend and pulls back to a demand zone.
Price touches the zone and starts to bounce. Retail traders enter long.
One or two candles later, price dips slightly below the demand zone, taking out the stops of everyone who entered on the first bounce.
That dip collects the liquidity institutions needed.
Price then reverses sharply and continues the original trend.
The key detail: the inducement break is small. It does not look like a trend reversal. It looks like a wick, a minor violation, a "stop run" that barely registers. That is what makes it so effective. It is just enough to trigger stops without looking like a structural change.
On the chart, inducements often appear as:
A wick below equal lows that formed during the pullback
A brief break of structure on a lower timeframe that does not hold
A candlestick pattern (like a bearish engulfing) that traps reversal traders into entering in the wrong direction
Why Tiny Breakouts Trigger Early Entries
The reason inducements work is simple: retail traders are trained to act on visible levels.
When price pulls back to a demand zone and bounces, the textbook play is to enter on the bounce. That is what courses teach. That is what YouTube videos show. And it works just often enough to keep traders believing in it.
But institutions know this. They know where the demand zone is. They know retail traders are watching it. And they know exactly where those traders will place their stops: right below the zone boundary.
So they push price through just enough to trigger those stops. The stops are sell orders. Those sell orders create a flood of selling pressure at the exact price level where institutions want to buy. It is a manufactured discount, funded entirely by retail stop losses.
This is why entering on the first touch of a zone is risky. The first move into a supply or demand zone is frequently the inducement, not the entry signal.
The Mechanics: How Banks Use Inducements to Fill
Understanding the mechanics removes the mystery. Banks and large institutions cannot enter positions the way you do. They cannot just click "buy" for 500 lots at market price. That order would move the market against them instantly.
Instead, they need to find pockets of liquidity where enough opposing orders exist to absorb their position without moving price. Inducements create those pockets by triggering retail stop losses at precisely the levels where institutions want to accumulate.
Here is a concrete example:
Walkthrough: Inducement Below a Demand Zone on AUD/USD
AUD/USD 15-minute chart. Price is trending up. A pullback forms equal lows at 0.6520. Price bounces from a demand zone at 0.6515 and starts moving up. A reversal trader buys at 0.6522 with a stop at 0.6505. Two candles later, price dips to 0.6505, stopping the trader out for a 17-pip loss. The dip is the inducement. It swept the stops below the equal lows and the demand zone. Price then reverses from 0.6505 and rallies to 0.6580. A trader who recognized the inducement and entered at 0.6518 after the sweep reversal candle, with a stop at 0.6498 (20-pip risk), captured 62 pips. That is 3.1R.
The retail trader got exactly the right idea but exactly the wrong timing. The inducement punished the early entry and rewarded the patient one.
Rules for Filtering Inducements from Real Breaks
You cannot avoid every inducement, but you can filter out most of them with a few rules:
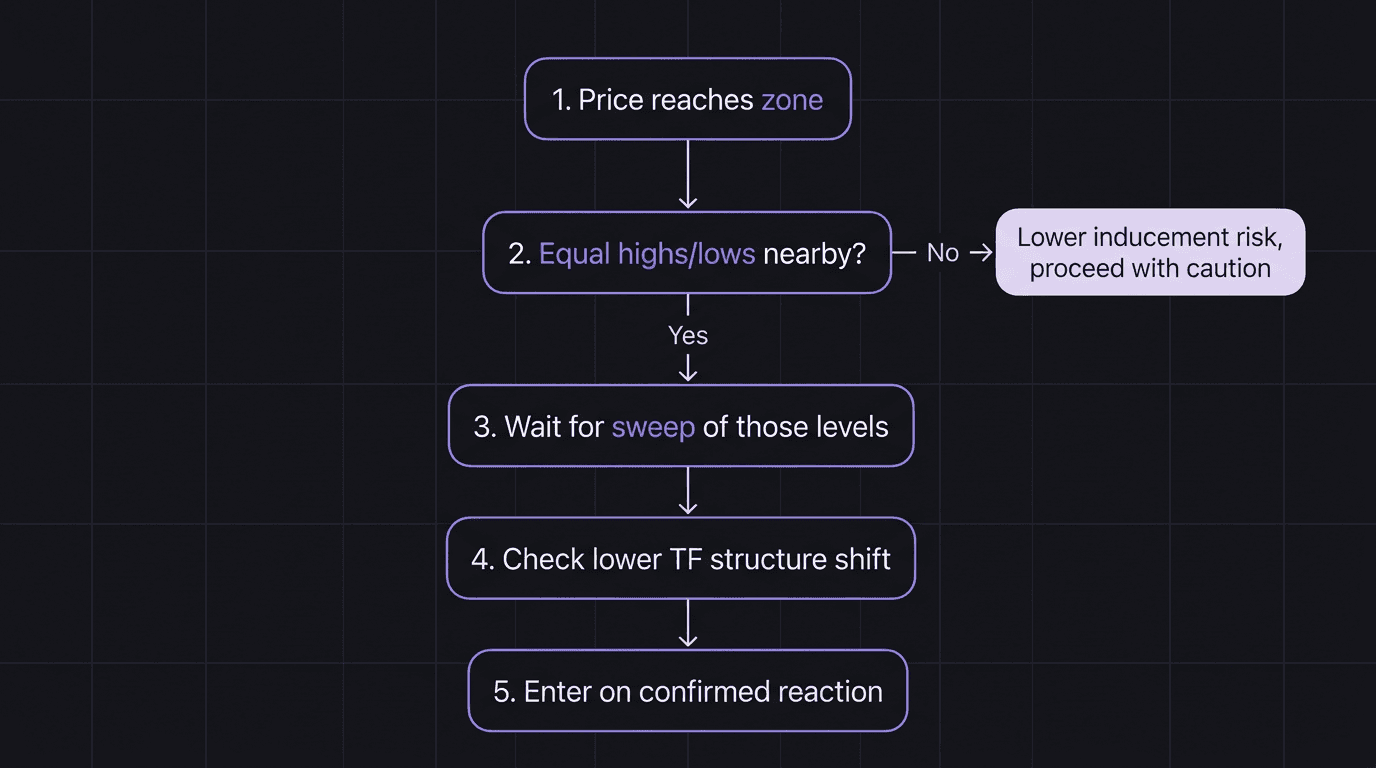
1. Never trade the first touch of a zone. The first time price returns to a demand or supply zone, there is inducement risk. Wait for the sweep, then look for a reaction-based entry.
2. Check for equal highs or lows near the zone. If a pullback has created equal lows just above your demand zone, those lows are a liquidity target. Expect them to get swept before the real move begins.
3. Watch the lower timeframe for structure shift. After the inducement sweep, drop to a 1-minute or 5-minute chart. If internal structure shifts (the most recent lower high gets taken out on a bullish setup), the inducement is likely complete and the real move is starting.
4. Measure the break size. Inducements are small. If price breaks a level by 5 to 15 pips and immediately snaps back, that is classic inducement behavior. A sustained break of 30 or more pips with follow-through candles is more likely a genuine break of structure.
5. Context matters. Inducements happen in trending markets during pullbacks. In ranging markets, the dynamics are different (that is more of a consolidation trap). Know which market context you are trading in before applying these rules.
Walkthrough: Missing the Inducement and Getting It Right the Next Time
A trader marks a demand zone on EUR/JPY at 163.20. Price pulls back to the zone and bounces. The trader buys at 163.25 with a stop at 163.00 (25-pip stop, approximately $16.50 risk per standard lot at $6.60/pip). Price dips to 163.10, inducing the trader to hold, then drops to 162.95, stopping them out. Loss: 30 pips at $6.60/pip per standard lot = $198 per lot.
The next day, the same setup appears at 162.80. This time the trader waits. Price sweeps equal lows at 162.70, dips to 162.65, and prints a strong reversal candle. The trader enters at 162.75 after the 5-minute structure shifts bullish. Stop at 162.55 (20-pip risk). Price rallies to 163.35. That is 60 pips at $6.60/pip = $396 per lot on $132 risk. R:R is 3.0.
Same trader, same zone concept, completely different result. The only difference was patience.
How EdgeFlo Helps You Wait for Confirmation
The hardest part of trading inducements is not recognizing them. It is sitting on your hands while the bait dangles in front of you.
EdgeFlo's pre-market checklist prompts you to define your entry criteria before the session starts. If your plan says "wait for sweep confirmation before entering zones," that rule is visible on screen while you are staring at the chart. It is harder to break a rule you can see.
FloAI (Plus plan) can also surface observations about structural patterns forming near your zones. It does not tell you what to trade, but it can flag when conditions look like an inducement setup so you are not caught off guard.
After the session, the journal auto-imports your trades and lets you tag them. Start tagging entries as "inducement" or "first touch" and review them weekly. Over time, you will build a dataset that proves whether waiting for the sweep actually improves your numbers. For most traders, it does.
What is an inducement in trading?
How do you tell an inducement from a real breakout?
Why do inducements happen near demand and supply zones?
Should you avoid all trades near inducement zones?

Turn discipline on.
Every session.
EdgeFlo is the environment serious traders operate inside.
Start 7-Day Trial — $7
Cancel anytime.
No long-term commitment.


Think Different, Trade Different.