

AI Trading Reports: How Automated Journal Analysis Finds Your Blind Spots
AI trading reports analyze your journal data to find patterns you miss. Learn how automated weekly reports identify blind spots and improve execution.

You review your trades every week. You look at win rate, P&L, maybe your average R. And you walk away thinking you have a handle on what went right and what went wrong.
But here is the problem: you are the worst person to analyze your own trading.
Not because you are lazy. Because you are biased. You remember the trades that hurt. You forget the patterns that quietly cost you hundreds of dollars over months. You rationalize your Friday revenge trades as "justified entries" because you remember the setup looking clean in the moment.
AI journal analysis solves this by reading your data without ego, without memory bias, and without excuses. It finds the patterns you cannot see because you are too close to them.
TL;DR
You cannot objectively analyze your own trading because of recency bias and emotional memory.
AI journal analysis reads your full trade data and flags recurring patterns across weeks and months.
Weekly reports catch tactical mistakes early, monthly reports reveal strategy drift.
Acting on AI recommendations requires changing one variable at a time, then measuring.
The value is not in the report itself but in the behavior change it triggers.
Why Traders Cannot See Their Own Patterns
Ever noticed how you always seem to lose on Fridays? Probably not. But your data might show a 28% win rate on Friday compared to 54% the rest of the week. That kind of pattern hides in plain sight.
Human review has three blind spots. First, recency bias. Your last three trades dominate your memory. A brutal loss on Thursday erases the quiet consistency of Monday through Wednesday. You end the week feeling like everything went wrong, even if you were net positive.
Second, emotional filtering. You remember trades that triggered strong feelings. The revenge trade that somehow worked. The perfect setup you hesitated on. But you forget the ten mediocre entries that bled your account by small amounts.
Third, pattern blindness. Some patterns only emerge across 50 or 100 trades. You overtrade during the first hour of London. You tighten your stop every time you are already up on the day. You size up after two wins in a row. These behaviors repeat unconsciously, and no amount of manual journaling catches them because you do not know to look for them.
Your trading dashboard shows you the numbers. AI tells you what the numbers mean.
Walkthrough: The Friday Pattern
Imagine you trade GBP/USD during London session, five days a week. After 80 trades over a month, your overall win rate sits at 47% with an average R of 1.8. Decent numbers.
But an AI report breaks that down by day. Monday through Thursday: 52% win rate, average R of 2.1. Friday: 29% win rate, average R of 0.9.
Fridays are dragging your overall stats down, but you never noticed because you never segmented the data yourself. The AI flags it: "Win rate drops 23 percentage points on Fridays. Consider reducing size or skipping Friday sessions."
That single observation, if you act on it, could shift your monthly P&L significantly.
What AI Journal Analysis Actually Does
AI journal analysis is not magic. It is pattern recognition applied to your trade data at scale. Here is what it actually processes:
Data it reads: Entry price, exit price, lot size, pair, session, timestamp, R-multiple, emotion tags, trade notes, and outcome grade.
Win rate by day of week, session, and pair
Average R by setup type
Emotion correlations (trades tagged "anxious" vs trades tagged "confident")
Streak behavior (what you do after 2 wins, what you do after 2 losses)
Position sizing drift (are you quietly sizing up after wins?)
What it outputs: Specific, data-backed observations. Not "trade better." Instead: "Your win rate on trades tagged 'confident' is 61%. On trades tagged 'anxious,' it drops to 31%. Your average lot size on anxious trades is 0.3 lots higher than confident trades."
That is the difference between a manual performance review and AI analysis. You ask, "How did I do this week?" AI asks, "What keeps happening that you do not realize?"
Weekly Reports vs Monthly Reports
Not all review cadences serve the same purpose. Weekly and monthly reports answer different questions.
Weekly reports catch tactical issues. They answer: "What happened this week that I should stop doing next week?"
A weekly report might flag that you took 12 trades in one session when your plan allows 5. Or that your average hold time dropped to 8 minutes when your strategy targets 45-minute swings. These are execution problems, and catching them within days prevents a small leak from becoming a blowout.
Monthly reports reveal strategic patterns. They answer: "Is my approach working over a meaningful sample?"
A monthly report looks at 40 to 80 trades and evaluates whether your equity curve is trending up, flat, or down. It compares your planned risk per trade to your actual risk. It checks whether your win rate and average R together produce positive expectancy.
The weekly report tells you what to fix. The monthly report tells you whether to keep the strategy or adjust it.
Walkthrough: Sizing Up After Wins
A monthly AI report covers your last 60 trades. It finds this pattern: after any sequence of 2 or more consecutive wins, your lot size increases by an average of 40% on the next trade. And the win rate on those oversized follow-up trades is 33%, compared to your baseline of 51%.
You are sizing up when you feel confident, but your data says confidence after a streak is not the same as edge. The fix is mechanical: cap your lot size at the same level regardless of recent results. The AI found it. You execute it.
Your trade journal template captures the raw data. The AI turns that data into actionable intelligence.
Acting on AI Recommendations
The report is worthless if you read it, nod, and change nothing. Here is the framework for turning AI observations into actual improvement.
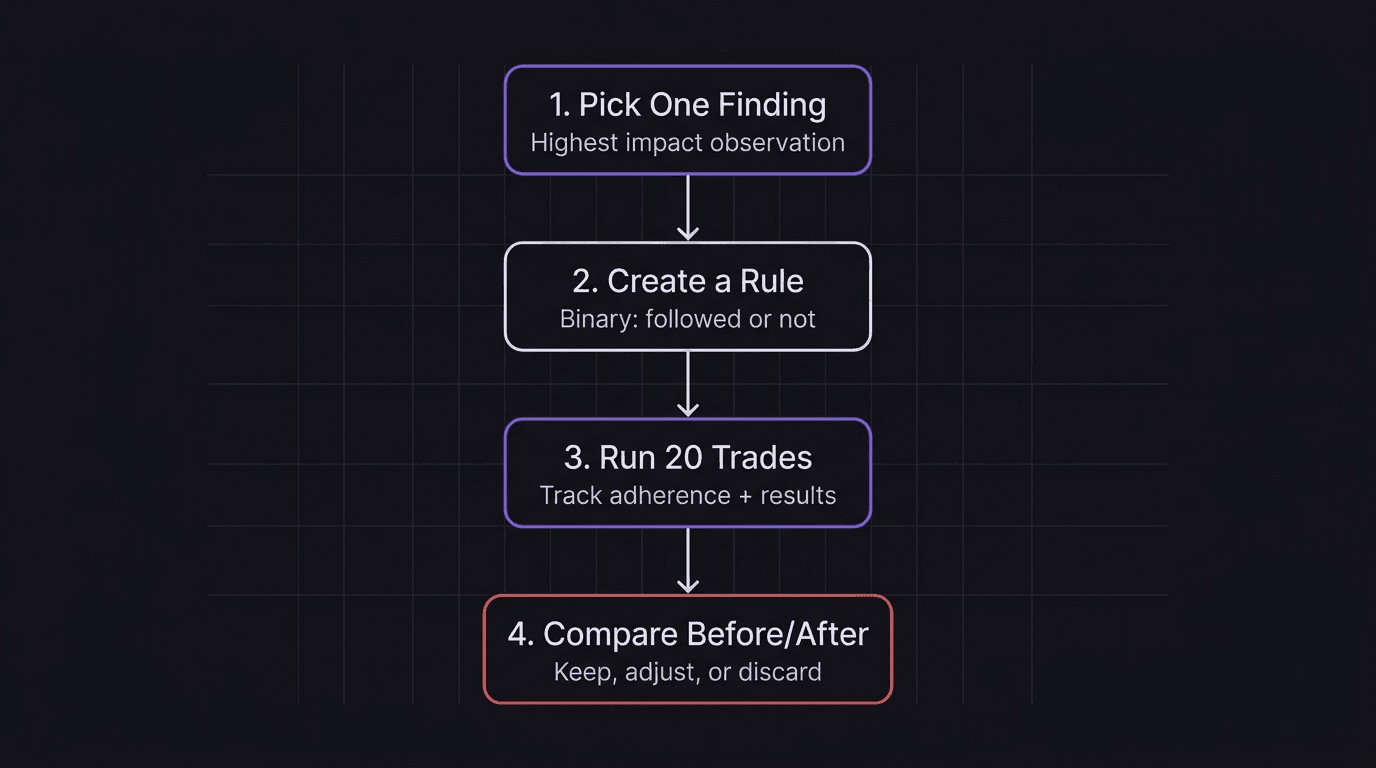
Step 1: Pick one finding. Do not try to fix everything at once. Choose the observation with the highest impact. If your Friday win rate is half your weekly average, that is high impact. If your average hold time drifted by 3 minutes, that is low impact.
Step 2: Create a rule. Turn the observation into a concrete, testable change. "Stop trading Fridays" or "Reduce lot size by 50% on Fridays" or "Only take A-grade setups on Fridays." Make it binary: you either followed the rule or you did not.
Step 3: Run 20 trades with the new rule. Do not evaluate after 3 trades. Give the change enough sample to show its effect. Track whether you actually followed the new rule (plan adherence) and whether your results shifted.
Step 4: Compare. After 20 trades, look at the before-and-after. Did Friday results improve? Did removing Fridays improve overall stats? If yes, the rule stays. If not, try a different variable.
This is the same review process you would use for any plan change, but AI accelerates the discovery phase. Instead of spending three months wondering why your results are flat, the AI points you to the problem in week one.
How EdgeFlo Generates AI-Powered Trading Reports
EdgeFlo generates weekly and monthly performance reports from your journal data (Plus plan). Every trade you take gets auto-imported with your emotion tags, screenshots, and notes. At the end of each week, the AI reads your full journal, identifies behavioral and statistical patterns, and delivers a report with specific observations about what went right, what went wrong, and what keeps repeating.
The reports do not tell you what to trade. They highlight what your own data reveals about your habits, your sizing behavior, your session performance, and your emotional patterns. You decide what to change. The AI makes sure you see what you would otherwise miss.
Combined with the trading dashboard and your own manual review discipline, these reports close the gap between knowing your numbers and actually understanding what they mean.
What does AI trading journal analysis actually do?
How often should I review AI trading reports?
Can AI replace manual trade review?
What data does AI need to generate useful reports?

Turn discipline on.
Every session.
EdgeFlo is the environment serious traders operate inside.
Start 7-Day Trial — $7
Cancel anytime.
No long-term commitment.


Think Different, Trade Different.