

Account Blow-Up Probability: The Math Behind Survival
Monte Carlo simulations show a 23% blow-up chance at 2% risk per trade, 3% at 1%, and 0.1% at 0.5%. See the data behind account survival.

Your account has a number. Not your balance, a probability. It represents the chance that your current risk per trade will eventually wipe you out entirely. At 2% risk per trade, that number is 23%. Nearly one in four. Drop to 0.5%, and it falls to 0.1%. The difference between those two numbers is the difference between surviving your first year and starting over from scratch.
This article breaks down Monte Carlo simulation data at three risk levels so you can see exactly where your blow-up probability sits and what to do about it.
TL;DR
At 2% risk per trade, 100-simulation Monte Carlo data shows a 23% chance of total account loss over 30 trades.
Cutting to 1% risk drops that probability to 3%. At 0.5%, it falls to 0.1%.
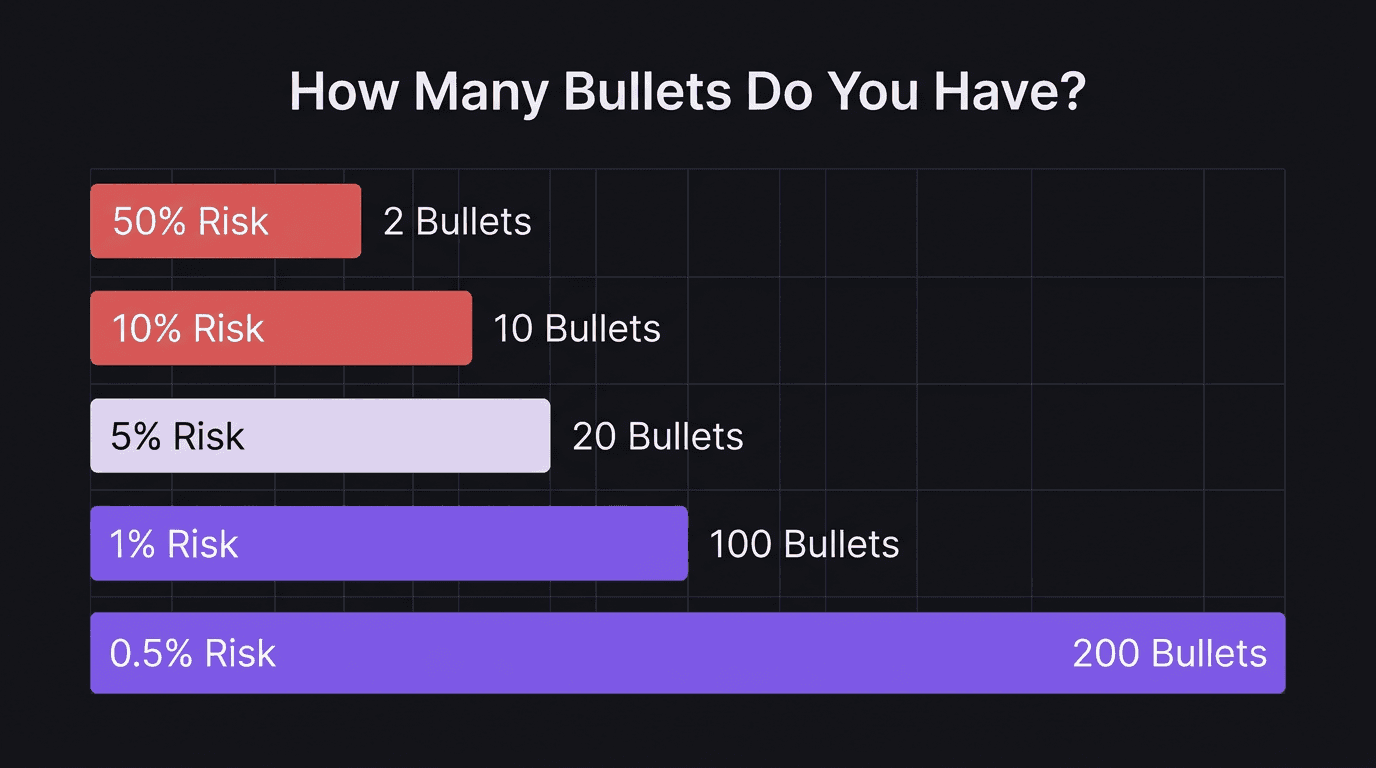
Your risk per trade determines how many "bullets" you have. At 1% risk you get 100, at 0.5% you get 200.
Average returns at 0.5% risk are still 14% over 30 trades with a 30% win rate and 5:1 reward ratio.
The 0.5% sweet spot keeps you in the game long enough for your edge to actually play out.
What Total Loss Risk Actually Means
Total loss risk is the probability that a trading strategy will drain your account to zero across a range of simulated outcomes. Not the chance of a bad week. Not a drawdown you can recover from. Complete wipeout.
Here is how it works: you take a strategy with known parameters (win rate, risk-to-reward ratio, risk per trade) and run it through 100 different randomized sequences of wins and losses. Each simulation produces a different equity curve. Some end in profit. Some end in a crater. The percentage of simulations that hit zero is your total loss risk.
Think of it like crash-testing a car 100 times. If 23 out of 100 tests end in a totaled vehicle, you would not drive that car. But traders do exactly this with their accounts every day.
The simulations here use a 30% win rate with a 5:1 risk-to-reward ratio over 30 trades on a $100,000 account. A 30% win rate sounds low, but paired with a high reward multiple, it is a realistic profile for traders who let winners run and cut losers fast. The only variable that changes across the three tests is risk per trade.
And that single variable changes everything.
The 2% Simulation: 23% Blow-Up Chance
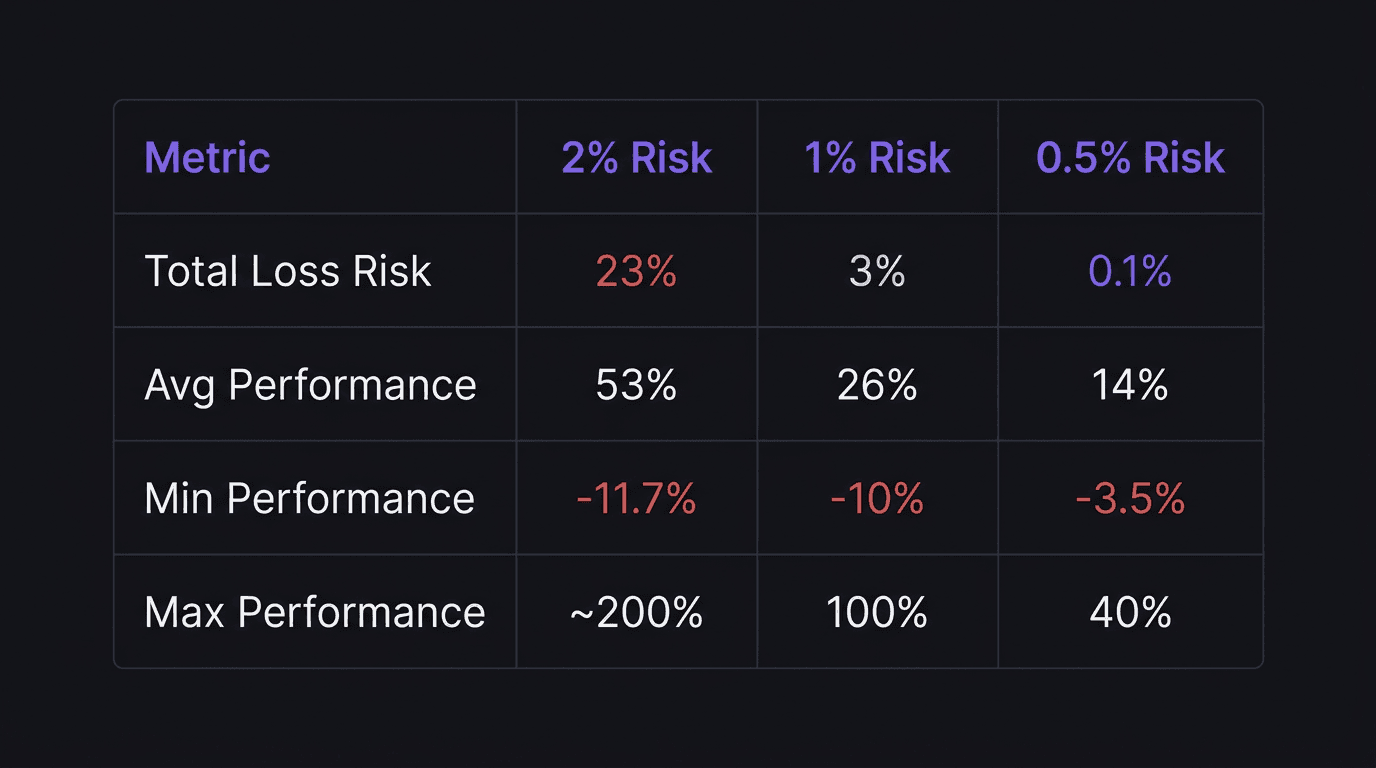
At 2% risk per trade, the 100-simulation Monte Carlo test produces these numbers:
Total loss risk: 23%
Average performance: 53%
Minimum performance: -11.7%
Maximum performance: ~200%
That average return looks attractive. A 53% gain over 30 trades sounds like exactly what you want. But look at the total loss risk again. Nearly one in four simulations ended with the account at zero.
Would you board a plane with a 23% crash rate? Probably not. But that is the exact bet traders make when they risk 2% per trade with a 30% win rate.
The minimum performance of -11.7% matters too. If your account drops 11.7%, you need a 13.2% gain just to get back to breakeven. That math gets ugly fast. Lose 50% and you need 100% to recover. This is why drawdown recovery gets exponentially harder the deeper the hole.
Walkthrough: How 2% Turns a Winning Strategy Into a Coin Flip
Imagine you open a $100,000 account and set your risk at 2% per trade, $2,000 per position. Your strategy has a 30% win rate with a 5:1 reward ratio. On paper, this is a profitable system. When you win, you gain 10% ($10,000). When you lose, you drop 2% ($2,000).
Now picture your first month. You take 30 trades. The random sequence lands you 9 winners and 21 losers (right at the 30% win rate). Winners: 9 x $10,000 = $90,000. Losers: 21 x $2,000 = $42,000. Net: +$48,000. Not bad.
But run that same system through a streak where your first 15 trades are all losses. You are down $30,000, a 30% drawdown, before you even hit a winner. And in 23 out of 100 simulations, the sequence is ugly enough to drain the account entirely. The strategy is profitable on average, but 2% risk per trade does not give you enough room to survive the worst-case paths.
That is the problem. You can have a winning strategy and still blow up if your risk per trade is too high for the variance.
The 0.5% Simulation: Near-Zero Risk
Drop the risk to 0.5% per trade and the same strategy (same 30% win rate, same 5:1 ratio, same 30 trades) tells a completely different story:
Total loss risk: 0.1%
Average performance: 14%
Minimum performance: -3.5%
Maximum performance: 40%
That 0.1% total loss risk means one simulation out of a thousand ends in a wipeout. At 0.5% risk, you would need to lose 200 consecutive trades to go to zero. Even if you randomly clicked buy and sell with no strategy at all, you would still win some trades. The math makes it nearly impossible to blow up.
The average return drops from 53% to 14%. That trade-off scares people. But here is what they miss: 14% over 30 trades is still strong. If you take 3-5 trades per week, those 30 trades represent roughly one month. A 14% monthly return, consistently, builds serious capital over time.
And look at the minimum performance: -3.5%. The absolute worst-case scenario over 30 trades is a 3.5% drawdown. Compare that to the -11.7% worst case at 2% risk. Recovering from a 3.5% loss requires a 3.6% gain. That is a single good trade at 0.5% risk with a 5:1 setup.
The 1% risk level sits in the middle: 3% total loss risk, 26% average performance, -10% minimum. Still vastly better than 2%, but 0.5% is where the survival math gets almost bulletproof.
Walkthrough: What NOT to Do, Scaling Up Too Fast
A trader on a $10,000 account has been risking 0.5% per trade ($50 per position) and averaging 12% monthly returns. After three good months, the account sits at roughly $14,000. Feeling confident, the trader bumps risk to 3% per trade ($420 per position) to "accelerate growth."
The next week delivers 5 consecutive losses. At 3% risk, that is a 15% drawdown. The account drops from $14,000 to about $11,900. Three months of disciplined growth, nearly erased in one bad week. The trader panics, starts revenge trading to recover, takes 4 more impulsive trades, loses 3 of them. Now the account is below $11,000 and the equity curve looks like it fell off a cliff.
The mistake was not the losing streak. Losing streaks are normal. The mistake was abandoning the 0.5% risk level that made the original growth possible.
How Many Bullets Do You Have
Risk per trade is the number of lives in your game. Every loss burns one. The question is whether you have enough left when the winning trades finally show up.
Here is the simple math:
50% risk per trade: 2 bullets. Two losses and you are done.
10% risk per trade: 10 bullets.
5% risk per trade: 20 bullets.
1% risk per trade: 100 bullets.
0.5% risk per trade: 200 bullets.
At 50% risk per trade, you are essentially flipping a coin on your account. Two bad trades and you are out. No recovery. No second chance. Even at 10% risk, a normal losing streak of 8-10 trades (which happens to every trader) takes you dangerously close to zero.
At 0.5%, you can survive a 20-trade losing streak and still have 90% of your capital left. That is 20 x 0.5% = 10% drawdown. Painful but manageable. And when your edge kicks back in, you have plenty of capital to size positions properly and recover.
The real danger is not a single bad trade. It is running out of bullets before the market gives you a good setup. Professional traders know that losing streaks are inevitable. The only question is whether you planned for them.
If you are trading without a stop loss, you do not even know how many bullets you have. That is worse than having two. It is having an unknown number that could be one.
The Recovery Trap
Here is the math that makes high risk per trade so destructive:
Lose 10% of your account and you need an 11.1% gain to recover.
Lose 25% and you need 33.3%.
Lose 50% and you need 100%.
Lose 75% and you need 300%.
The deeper the hole, the steeper the climb. At 0.5% risk per trade, your worst realistic drawdown is small enough that recovery takes days, not months. At 2% or higher, a bad streak can put you in a hole that takes the rest of the quarter to dig out of, if you dig out at all.
This is why a daily loss limit works alongside low risk per trade. Even at 0.5% per position, three consecutive losses in a single session can trigger tilt. Setting a rule to stop after three losses preserves both capital and clarity.
How EdgeFlo Helps You Stay in the Game
Knowing the math is one thing. Following it when EUR/USD is spiking and you want to load up, that is the hard part. EdgeFlo auto-calculates lot size based on your risk settings, so you never have to do the math under pressure. Set your risk to 0.5%, and your position size adjusts automatically for every trade.
That removes the moment where most blow-ups actually start: the manual override. The moment you think "just this once, I will risk a little more." EdgeFlo keeps the calculation honest. You can still override it (guardrails are not prison bars) but you have to deliberately choose to break the rule instead of drifting into it.
The result is a consistent equity curve that an investor (or a prop firm) would actually trust. And that is the real test of capital management: not your best month, but whether your account survives the worst one.
The Edge Brief
Receive Insights on trading psychology, discipline, and the behavioral patterns that create consistent traders from our Founder and the EdgeFlo team, delivered to your inbox.
Think different. Trade different.
What is a good risk per trade to avoid blowing an account?
What does total loss risk mean in trading?
Can you still be profitable risking only 0.5% per trade?
Why do most traders blow their accounts?

Turn discipline on.
Every session.
EdgeFlo is the environment serious traders operate inside.
Start 7-Day Trial — $7
Cancel anytime.
No long-term commitment.


Think Different, Trade Different.