

Win Rate vs R Multiple: Which Actually Matters
A 60% win rate with 3R average beats an 80% win rate with 1R. Learn the math that proves R multiple matters more than win rate and how to track both.

You win 8 out of 10 trades. Your friend wins 4 out of 10. You must be the better trader, right?
Not necessarily. If your average win is $100 and your average loss is $400, those 8 wins net you $800 while those 2 losses cost you $800. You break even. Your friend wins $500 on each win and loses $100 on each loss. Four wins minus six losses equals $1,400 profit.
Win rate alone tells you nothing about profitability. The size of your wins relative to your losses tells you everything.
TL;DR
Win rate measures how often you are right. R multiple measures how much you make when you are right versus how much you lose when you are wrong.
A 40% win rate with a 3R average is more profitable than an 80% win rate with a 0.8R average.
Expectancy combines both metrics into one number that predicts whether your system makes money over time.
Track both win rate and average R in your trading dashboard to see the full picture.
Chasing higher win rates often means cutting winners short, which destroys R multiples.
What Win Rate Actually Tells You
Win rate is the percentage of trades that close in profit. If you take 100 trades and 55 are winners, your win rate is 55%.
That number feels important because your brain craves being right. Every losing trade stings. Every winner feels like validation. So traders naturally gravitate toward strategies that produce a high win rate, even if the math behind those strategies is terrible.
Here is the problem: win rate says nothing about the magnitude of wins and losses. A scalper who takes 30 trades a day with a 90% win rate might be making $20 per win and losing $250 per loss. Nine wins ($180) minus one loss ($250) equals negative $70. The scoreboard says 9 to 1. The account says red.
What R Multiple Actually Tells You
R multiple measures each trade's outcome as a ratio of the risk you took.
If you risk $200 on a trade and make $600, that is a 3R win. If you risk $200 and lose $200, that is a 1R loss. If you risk $200 and lose $100 (closed early or partial stop), that is a 0.5R loss.
Your average R multiple across all winning trades tells you how much profit your system generates per unit of risk when it works. Combined with your average losing R (ideally close to 1R if you respect stops), it reveals the true character of your strategy.
A trader with a 2.5R average win size does not need to be right very often to make money. A trader with a 0.5R average win size needs to be right constantly just to stay flat.
Head-to-Head: The Math That Settles It
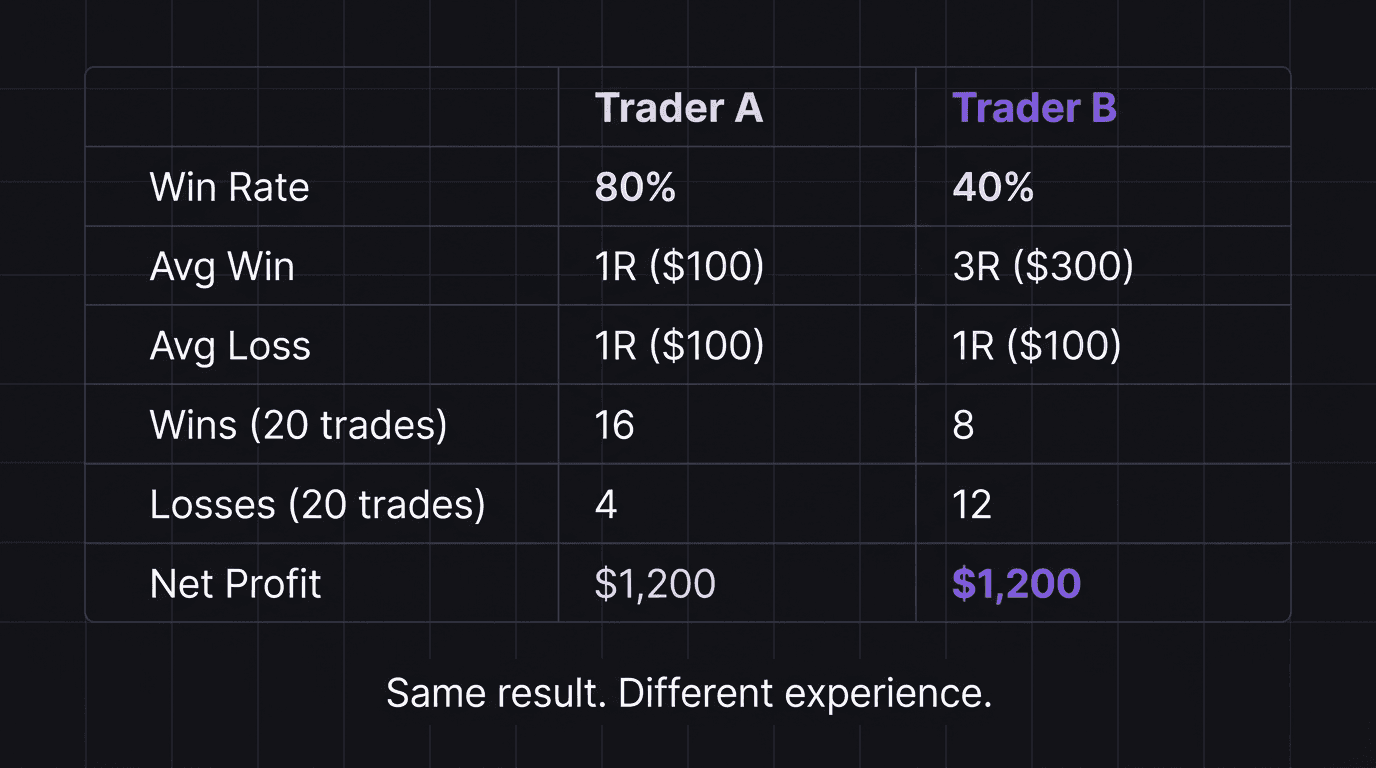
Two traders. Same $10,000 account. Same 1% risk per trade ($100 risk). Each takes 20 trades in a month.
Trader A: High Win Rate, Low R
Win rate: 80% (16 wins, 4 losses)
Average win: 1R ($100)
Average loss: 1R ($100)
Total wins: 16 times $100 = $1,600
Total losses: 4 times $100 = $400
Net profit: $1,200
Trader B: Low Win Rate, High R
Win rate: 40% (8 wins, 12 losses)
Average win: 3R ($300)
Average loss: 1R ($100)
Total wins: 8 times $300 = $2,400
Total losses: 12 times $100 = $1,200
Net profit: $1,200
Same profit. But look at the experience. Trader A won 80% of the time and felt great every day. Trader B lost more often than they won and had to sit through 12 losses in a single month.
Now bump Trader B's average win to 4R instead of 3R.
Trader B (adjusted): 40% Win Rate, 4R Average
Total wins: 8 times $400 = $3,200
Total losses: 12 times $100 = $1,200
Net profit: $2,000
Trader B now makes $800 more per month than Trader A despite being "wrong" 60% of the time. That gap compounds over quarters and years.
Why Chasing Win Rate Destroys R Multiple
Here is the trap. To increase your win rate, you typically need to do one of two things: take profit earlier (before the market can reverse against you) or avoid trades that look uncertain (only taking "sure things").
Both behaviors shrink your R multiple.
If you cut winners at 1R instead of letting them run to 3R, you win more often but each win is worth a third as much. If you skip trades that look 50/50 but carry high R potential, you miss the outlier wins that drive profitability.
The R multiple approach forces you to let winners run. That feels uncomfortable in the moment because you are watching unrealized profit fluctuate. But it is mathematically necessary for most strategies to work.
Expectancy: The Metric That Combines Both
Neither win rate nor R multiple tells the full story alone. Expectancy does.
Expectancy = (Win Rate times Average Win) minus (Loss Rate times Average Loss)
Using Trader B's numbers:
Expectancy = (0.40 times $300) minus (0.60 times $100)
Expectancy = $120 minus $60
Expectancy = $60 per trade
For every trade Trader B takes, they expect to make $60 on average. Over 20 trades, that is $1,200. The number matches the direct calculation above, confirming the math.
Positive expectancy means the strategy makes money over a large sample. Negative expectancy means it loses money no matter how good individual trades feel. Track this on your trading dashboard monthly.
How a 30% Win Rate Still Profits
Some professional trading systems run at 25% to 35% win rates. They lose most of the time. But when they win, they win big.
Here is a 30% win rate example over 20 trades with $100 risk per trade and a 5R average win:
Wins: 6 trades at $500 each = $3,000
Losses: 14 trades at $100 each = $1,400
Net profit: $1,600
Expectancy per trade: (0.30 times $500) minus (0.70 times $100) = $150 minus $70 = $80
That is $80 expected profit per trade. The trader loses 14 out of 20 trades and still makes $1,600 in the month. The key is that they never cut winners early and they never let losers run past 1R.
Living with a 30% win rate requires serious psychological resilience. You will have 5, 6, even 8 consecutive losses and need to keep taking the next setup. This is where your equity curve data becomes your anchor. If the curve trends up over 50 to 100 trades, the losing streaks are just noise.
Which Should You Optimize?
Neither. You should optimize expectancy.
If your current win rate is 50% and your average R is 1.5, your expectancy is (0.50 times 1.5R) minus (0.50 times 1R) = 0.75R minus 0.5R = 0.25R per trade. That is positive but thin.
You have two paths to improve:
Raise average R by holding winners longer, using technical exits instead of fixed targets, or filtering for higher-R setups. This might lower win rate slightly but increase per-trade expectancy.
Raise win rate by improving entry timing, adding confirmation filters, or being pickier about which setups you take. This might lower trade frequency but each trade has higher conviction.
The best traders find the version of their strategy where both metrics sit in a sustainable range. Not the highest win rate. Not the highest R. The combination that produces the highest expectancy they can execute consistently.
How EdgeFlo Tracks Win Rate and R Multiple Together
EdgeFlo's dashboard displays your win rate and average R side by side so you see the relationship, not just one number in isolation. The weekly AI report (Plus) highlights when your R multiple is trending down even if your win rate looks healthy, catching the early signal before it shows up as a drawdown.
Your journal records the planned R and actual R for every trade. Over time, this reveals whether you are consistently cutting winners short (actual R lower than planned R) or letting losers run (actual loss larger than 1R). Those patterns are the levers that move expectancy.
Tracking both metrics in one place turns a vague feeling ("I think I'm doing okay") into a specific number you can act on.
Can you be profitable with a 30% win rate?
What is a good R multiple for day trading?
Why do high win rate strategies still lose money?
How do I track R multiples in my journal?

Turn discipline on.
Every session.
EdgeFlo is the environment serious traders operate inside.
Start 7-Day Trial — $7
Cancel anytime.
No long-term commitment.


Think Different, Trade Different.