

Would an Investor Fund You? Score Your Equity Curve
If a prop firm or investor saw your equity curve, would they trust you with capital? Use this framework to grade yourself honestly.

Pull up your equity curve right now. Look at the shape of it. Not the dollar amount at the end, not the best month, not the worst day. Just the shape.
Now ask yourself one question: if an investor saw this chart, would they hand you a million dollars to manage?
If the answer is no, you have a risk management problem. And that problem is costing you more than money. It is costing you access to real capital, whether that means prop firm funding, investor backing, or simply the confidence to size up your own account.
TL;DR
Your equity curve tells investors (and you) whether your trading is fundable.
A smooth upward slope with controlled drawdowns is the only shape that attracts capital.
Grade your curve on five criteria: slope, drawdown depth, drawdown recovery time, consistency, and variance.
Most traders fail this test not because of strategy, but because of undisciplined execution.
Running the investor test monthly turns your dashboard into an accountability system.
What Investors Actually Look For
Forget the Instagram traders showing green days. Real capital allocators (prop firms, family offices, even serious personal accounts) evaluate traders the same way they evaluate any investment: through the equity curve.
Here is what they see in 10 seconds:
Smooth upward slope. The curve trends up from left to right. Not in a straight line (that is suspicious), but in a generally ascending path with minor pullbacks. This signals a positive expectancy system applied consistently.
Shallow drawdowns. No single drawdown wipes out more than 10% of the peak. Ideally, maximum drawdown stays under 5%. A trader who drops 20% and recovers is less attractive than a trader who never drops more than 5%.
Quick recovery. When drawdowns happen, they resolve within a reasonable number of trades. Long flat periods (called "underwater time") suggest the trader's edge disappears during losing streaks, which often means emotional interference.
Low variance between months. A trader who makes 30% one month and loses 15% the next is a gambler with a hot streak. A trader who makes 3% to 5% every month for a year is a machine. Investors fund machines.
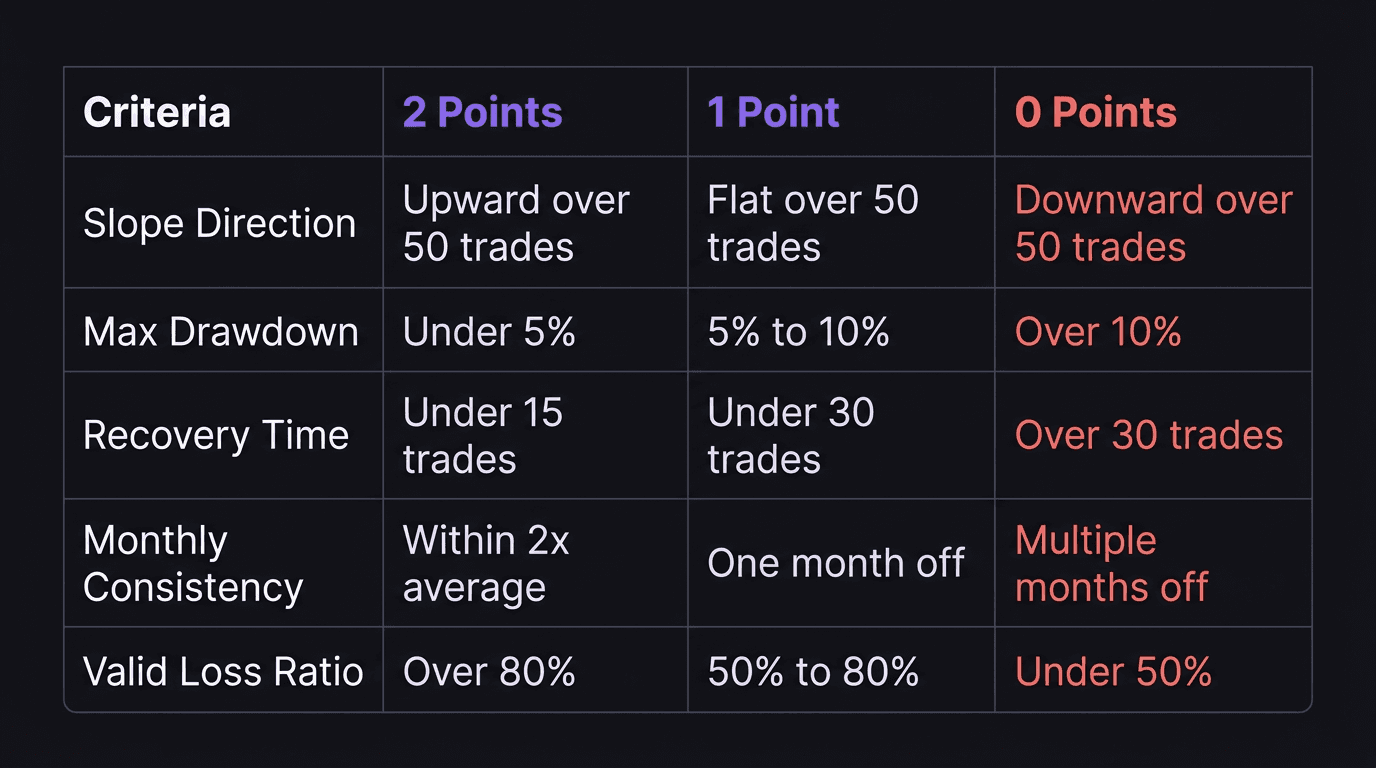
The Five-Point Investor Scorecard
Use this scorecard to grade your equity curve once per month. Score each category from 0 to 2 points. A passing grade is 7 out of 10.
1. Slope Direction (0, 1, or 2 points)
2 points: Curve has trended upward over the last 50 trades.
1 point: Curve is roughly flat over the last 50 trades.
0 points: Curve has trended downward over the last 50 trades.
2. Maximum Drawdown (0, 1, or 2 points)
2 points: Largest drawdown from peak is under 5%.
1 point: Largest drawdown from peak is between 5% and 10%.
0 points: Largest drawdown from peak exceeds 10%.
3. Drawdown Recovery Time (0, 1, or 2 points)
2 points: Every drawdown recovered within 15 trades.
1 point: Most drawdowns recovered within 30 trades.
0 points: Any drawdown took more than 30 trades to recover, or has not recovered.
4. Monthly Consistency (0, 1, or 2 points)
2 points: No single month's return deviates more than 2x from your average monthly return.
1 point: One month deviated more than 2x.
0 points: Multiple months deviated more than 2x.
5. Valid vs Invalid Loss Ratio (0, 1, or 2 points)
2 points: More than 80% of all losses were plan-aligned (valid losses).
1 point: Between 50% and 80% were valid losses.
0 points: Fewer than 50% were valid losses.
How to Interpret Your Score
8 to 10: Your equity curve is fundable. A prop firm or investor would look at this and see consistency and risk control. Keep doing what you are doing.
5 to 7: Getting close. There is an edge showing, but execution gaps are visible. Review which categories scored lowest and focus there.
Below 5: Not fundable yet. This does not mean your strategy is bad. It likely means discipline is leaking somewhere: oversized positions, revenge trades, or inconsistent rule application.
Walkthrough: Scoring a Real Equity Curve
You trade a $10,000 account, risking 0.5% per trade ($50 per trade). Over the past 60 trades spanning three months, your results look like this:
- Month 1: 20 trades, net gain $320 (3.2%). - Month 2: 22 trades, net gain $410 (4.1%). - Month 3: 18 trades, net loss $180 (1.8% drawdown after the Month 2 peak).
Your peak account value was $10,730 at the end of Month 2. Your current value is $10,550.
Scoring:
1. Slope: Curve is up overall ($10,000 to $10,550). 2 points. 2. Max Drawdown: $10,730 peak to $10,550 current = $180 drawdown. $180 / $10,730 = 1.68%. Under 5%. 2 points. 3. Recovery: The drawdown started 18 trades ago and has not fully recovered yet, but 18 is under 30. 1 point. 4. Monthly Consistency: Average monthly return is about 1.8% ((3.2 + 4.1 - 1.8) / 3). Month 2 at 4.1% is 2.28x the average. Slightly over 2x. 1 point. 5. Valid Losses: You review your journal and find 85% of losses were plan-aligned. 2 points.
Total: 8 out of 10. Fundable range. The main areas to watch are drawdown recovery speed and monthly return consistency.
Walkthrough: A Curve That Fails the Test
A second trader also has a $10,000 account and risks 0.5% per trade. But their behavior is different.
- Month 1: 35 trades (overtrading), net gain $520 (5.2%). - Month 2: 40 trades, net loss $890 (8.5% drawdown from peak). - Month 3: 15 trades (scared after the drawdown), net gain $120 (1.3%).
Peak was $10,520 after Month 1. Low was $9,630 after Month 2. Current is $9,750.
Scoring:
1. Slope: Curve is down overall ($10,000 to $9,750). 0 points. 2. Max Drawdown: $10,520 to $9,630 = $890. $890 / $10,520 = 8.46%. Between 5% and 10%. 1 point. 3. Recovery: 55 trades in and the drawdown has not recovered. 0 points. 4. Monthly Consistency: Returns of +5.2%, -8.5%, +1.3%. Wildly inconsistent. 0 points. 5. Valid Losses: Journal review shows only 40% of losses were plan-aligned. The rest were revenge trades and FOMO entries. 0 points.
Total: 1 out of 10. No investor would touch this curve. The fix is not a better strategy. The fix is fewer trades, smaller risk during drawdowns, and disciplined execution.
Why This Test Matters Even If You Never Seek Funding
You might not want prop firm money. You might not care about investors. The test still matters because it forces you to answer the hardest question in trading: am I actually good, or am I just lucky?
A high score on the investor test over 100 or more trades is statistical evidence that your system works and that you execute it consistently. A low score is evidence that something is broken, and it tells you exactly where.
The equity curve does not lie. Your P&L summary can hide bad periods inside good ones. Your win rate can look fine while your drawdowns are destroying your capital base. But the equity curve shows everything: every spike, every crash, every recovery, every plateau.
Run the test monthly. Track your score over time. If your score is climbing, you are becoming a better trader. If it is falling, something changed in your execution, and you need to find it before it costs you more.
How EdgeFlo Helps You Run the Investor Test
EdgeFlo's trading dashboard generates your equity curve automatically from your journal data. You do not need to build a spreadsheet or manually plot trade results. The curve updates after every logged trade, and your performance review tools break down drawdown depth, recovery time, and consistency metrics in one view.
Running the investor test in EdgeFlo takes five minutes per month. Pull up the dashboard, check each scorecard criterion against the data on screen, and log your score. Over time, you build a record of your growth as a trader, backed by numbers instead of feelings.
The question is not whether you are profitable this week. The question is whether your equity curve tells the story of someone who deserves more capital. If the answer is yes, the capital will follow.
What makes an equity curve investable?
How many trades do I need before the investor test is meaningful?
Can a losing account still pass the investor test?
Should I apply the investor test to my demo account?

Turn discipline on.
Every session.
EdgeFlo is the environment serious traders operate inside.
Start 7-Day Trial — $7
Cancel anytime.
No long-term commitment.


Think Different, Trade Different.