

Trading Journal Review Cadence: Daily to Quarterly
The right trading journal review cadence uses four levels: daily quick log, weekly patterns, monthly stats, and quarterly rule changes. Here is how each works.

A trading journal review cadence determines when you look at your data, what you look for, and what decisions you are allowed to make at each level. Most traders either review too often (changing rules after every losing day) or not often enough (running the same broken process for months).
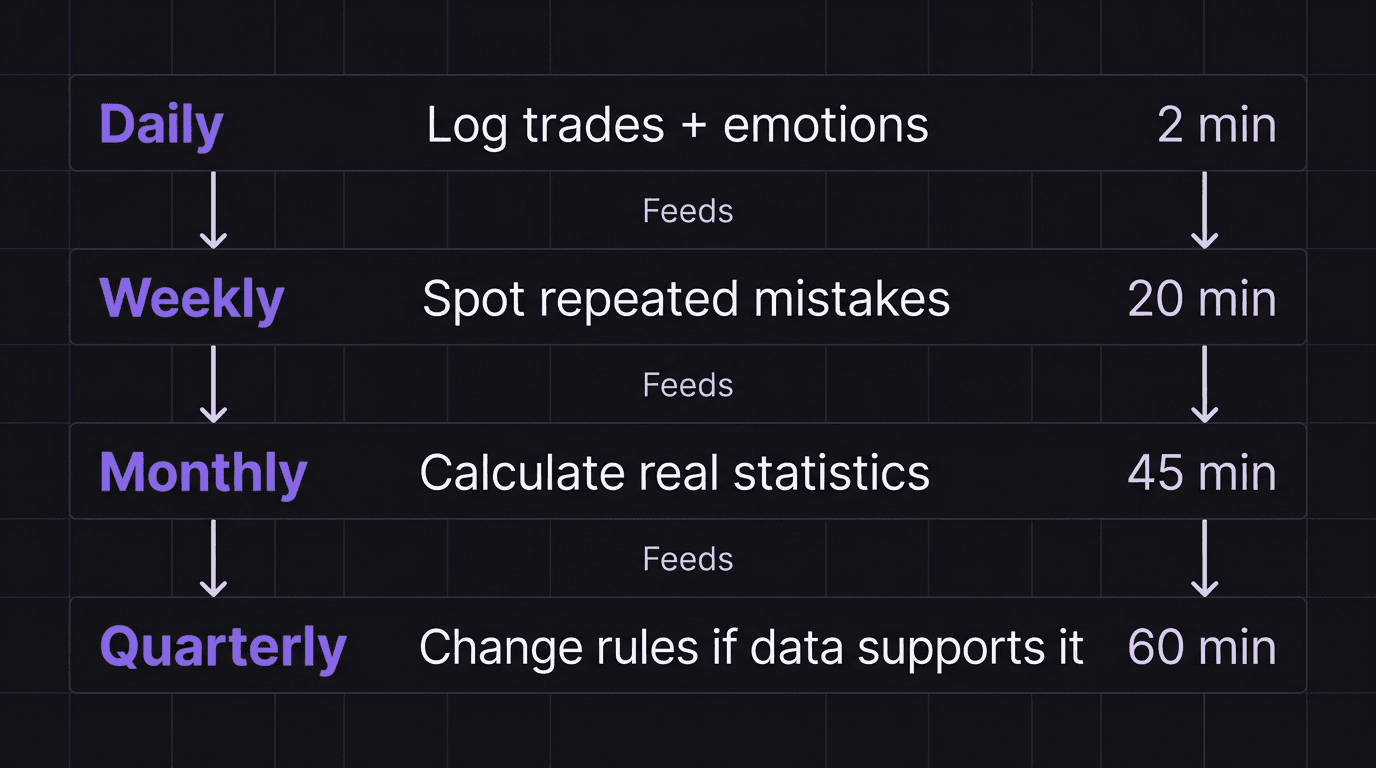
The fix is a layered system. Daily captures data. Weekly spots patterns. Monthly confirms trends. Quarterly changes rules. Each level feeds the one above it, and no level tries to do another level's job.
TL;DR
One review frequency is not enough. You need four: daily, weekly, monthly, and quarterly.
Daily is a 2-minute data capture, not analysis. Log the trade, tag the emotion, move on.
Weekly is a 20-minute pattern check for repeated mistakes and missed setups.
Monthly is where you calculate real statistics over 20 or more trades.
Quarterly is the only time you change your actual trading rules.
Why One Review Frequency Is Not Enough
If you only review monthly, you spend four weeks repeating the same mistake before you notice it. If you only review daily, you over-react to noise and change your strategy after two losses.
The core problem is that different questions require different sample sizes to answer.
"Did I follow my plan today?" needs one session of data. "Am I consistently entering too early?" needs a week. "Is my win rate actually 35% or was that a bad stretch?" needs a month. "Should I change my entry criteria?" needs a quarter.
When traders collapse all of these questions into a single review session, they make bad decisions. They change rules based on three trades. They ignore patterns because they only look at the data once a month.
A structured review cadence separates these decisions so each one gets the data it deserves.
Daily: The Quick Log
The daily log is not a review. It is data capture. Your only job after each session is to record what happened while the details are fresh.
Time required: 2 minutes per trade.
What to log:
Entry and exit prices
The setup grade (plan-win, plan-loss, off-plan-win, off-plan-loss)
Your emotional state before and during the trade
One sentence: what you would do differently if you could rewind
That last item is critical. Tomorrow, you will not remember how you felt at the moment of entry. But if you write "I felt rushed because I saw the candle moving and jumped in without waiting for the close," that is evidence you can use during your weekly review.
Do not analyze the day. Do not calculate your weekly P&L. Do not second-guess your entries. Just log and walk away. The analysis comes later.
Walkthrough: A Clean Daily Log
Date: Monday, March 10 Pair: EUR/USD Setup: Demand zone bounce at 1.0825 during London session Entry: 1.0830 | Stop: 1.0805 | Target: 1.0880 Grade: Plan-win Emotion: Calm before entry. Slightly anxious at 1.0840 when price stalled. Held per plan. One thing: I almost moved my stop to break-even at 1.0840. Next time, trust the zone.
That took 90 seconds. The value is not in this single entry. The value appears when you have five of these lined up at the end of the week.
Weekly: Pattern Spotting
The weekly review is where your journal data becomes useful. You are not looking at individual trades anymore. You are looking across five days for repeating behaviors.
Time required: 20 minutes every Friday or Sunday.
What to check:
Grade distribution: How many plan-wins vs off-plan trades? If off-plan exceeds 30%, you have an execution problem.
Repeat mistakes: The same error appearing twice or more in one week is a pattern, not bad luck.
Missed setups: Valid setups you identified but did not take. Track whether missed trades stem from hesitation, timing, or absence.
Emotional sequences: Did a loss on one day change your behavior the next day?
End the review with one action item for the coming week. Not a rule change. An awareness target. Something like: "Track whether I am entering before the candle close this week."
The weekly level is diagnostic. It tells you what is happening. It does not prescribe fixes yet.
Monthly and Quarterly: Rule-Level Changes
Monthly Review (45 Minutes)
The monthly review is your first real statistical checkpoint. With 15 to 30 trades logged, you can start to see whether your strategy is performing as expected.
Calculate these numbers from your journal template:
Win rate: Wins divided by total trades. Compare to your backtest benchmark.
Average R: Average win size divided by your risk amount. If your average win is 2.1R and average loss is 1R, your edge is intact.
Plan adherence rate: Plan-trades divided by total trades. This number matters more than win rate at this stage.
Most common off-plan behavior: Pull from your weekly reviews. What is the single biggest repeating error?
The monthly review confirms or denies what your weekly reviews suggested. If your weekly reviews flagged early entries three weeks in a row, the monthly data should show whether those early entries are actually costing you money or just causing anxiety.
Do not change rules based on monthly data alone. One month of trading is still too small a sample for permanent strategy adjustments, especially if you trade fewer than 20 times per month.
Quarterly Review (60 Minutes)
This is the only time you change your actual trading plan.
Your quarterly review compiles three months of data (typically 50 to 100 trades). That is enough to separate real patterns from noise.
Questions for the quarterly review:
Is my win rate within 5% of my backtest benchmark?
Is my average R above my minimum threshold?
Which rule, if added or removed, would have the biggest impact on my last 90 days?
Am I consistently missing a specific type of setup that belongs in my plan?
If the data supports a change, make one adjustment. Test it for the next quarter. Do not overhaul your entire system based on one quarterly review.
Walkthrough: A Quarterly Rule Adjustment
A trader reviews Q1 data: 72 trades total. Win rate: 38%. Average R: 2.4R. Plan adherence: 74%.
The monthly reviews flagged that 60% of off-plan trades happened during the New York afternoon session. The trader's plan says "trade New York session," but the data shows the afternoon sub-session consistently produces off-plan behavior.
Rule change: Narrow the session window to end at 12:00 PM New York time. No trades after that.
The trader tests this rule change through Q2 and re-evaluates at the next quarterly review.
The key detail: the trader did not make this change after one bad week. The pattern showed up in weekly reviews, persisted through monthly confirmations, and only became a rule change after 72 trades of evidence.
What Your Review Cadence Protects You From
Without a structured cadence, traders fall into two traps.
Trap 1: Over-optimization. Changing rules after every bad day. This turns a stable strategy into a constantly shifting target. You never collect enough data to know whether any version of your plan actually works.
Trap 2: Willful blindness. Never reviewing at all. This means repeating the same mistakes for months while blaming the market. The most common excuse is "I know what I'm doing wrong, I just need more discipline." That is almost never true. What you need is data showing you exactly when and how you break your rules.
The cadence solves both by giving each question the right timeframe. Quick emotional data at the daily level. Behavioral patterns at the weekly level. Statistical truth at the monthly level. Rule changes at the quarterly level.
Every level feeds the one above it. If your daily logs are empty, your weekly reviews have nothing to work with. If your weekly reviews are skipped, your monthly statistics lack context. The system only works when every layer is active.
How EdgeFlo Supports Your Review Cadence
EdgeFlo's AI-powered trading journal auto-imports trades and lets you tag emotions at entry and exit. That daily log that takes 2 minutes on a spreadsheet takes 30 seconds when the trade data is already there.
The trading dashboard tracks your plan adherence rate and grade distribution automatically, so your weekly review starts with the numbers already calculated. The weekly AI report (Plus plan) flags repeated behavioral patterns across your recent trades before you even open the review.
For monthly and quarterly analysis, the dashboard shows rolling win rate, average R, and equity curve in one screen. You are not digging through spreadsheets for an hour. You are spending that time thinking about what the numbers mean and whether a rule change is warranted.
How often should I review my trading journal?
What is the daily trading journal for?
When should I change my trading rules based on journal data?
Can I skip the weekly review and go straight to monthly?

Turn discipline on.
Every session.
EdgeFlo is the environment serious traders operate inside.
Start 7-Day Trial — $7
Cancel anytime.
No long-term commitment.


Think Different, Trade Different.