

Trading Is Not Chart Reading
Great chart readers still lose money. Trading is a game of psychology and belief, not technical analysis alone. Here is what actually separates winners.

The market is full of traders who can mark supply and demand zones, identify liquidity sweeps, and read market structure like professionals. And most of them are still losing money.
That is not a paradox. It is proof that trading is not chart reading. Charts are the easy part. The hard part is what happens between your ears when money is on the line.
You are not trading against lines on a screen. You are trading against your own reactions to uncertainty. Every candlestick that moves against you triggers a biological response that has nothing to do with your analysis and everything to do with your survival wiring. The traders who figure this out stop looking for better setups and start building better execution systems.
TL;DR
Chart reading is a necessary skill, but it is not what separates profitable traders from unprofitable ones.
The same pattern produces different results each time because markets are probabilistic.
Most losses come from execution failures (early exits, skipped trades, oversized positions), not bad analysis.
Trading is a game of psychology and belief, not pattern recognition alone.
Focus on process over outcomes to close the gap between what you know and what you do.
The Analysis Trap
Most traders believe the path to profitability looks like this: learn better analysis, find better setups, make more money. So they study chart patterns. They learn supply and demand. They add indicators. They switch to smart money concepts. They attend webinars.
And when the new approach does not work immediately, they switch to another system. The assumption is always the same: "My analysis is not good enough yet."
But here is what the data usually shows when these traders review their journals. They identified the right direction 60% of the time. They entered at reasonable levels. Their stop losses were logical. The analysis was fine.
The losses came from:
Closing winners at 15 pips instead of letting them run to the planned 50
Skipping three valid setups in a row because the last trade was a loss
Doubling position size because "this one looks perfect"
Moving the stop loss further away instead of accepting invalidation
None of those problems are chart-reading problems. They are execution problems driven by emotion.
The Pattern Repetition Illusion
Here is something that trips up intermediate traders: the belief that because a pattern worked last time, it should work this time.
You see a bullish engulfing candle at a demand zone. Last Tuesday, you traded that exact pattern on the same pair and made 60 pips. Your brain says, "Same setup, same result."
But the market does not owe you consistency. The same pattern can appear in identical-looking conditions and produce completely different results. Last Tuesday, buyers stepped in with volume. This Tuesday, institutions used that same level to fill short orders.
The pattern did not change. The participants behind the pattern changed. And you cannot see participants on a chart.
This is why probabilistic thinking matters more than pattern recognition. You need to accept that any individual trade can go either way, regardless of how perfect the setup looks. Your edge exists over 100 trades, not over 1.
Walkthrough: Two Identical Setups, Opposite Outcomes
Trade 1 (Monday): EUR/USD shows a bullish break of structure on the 15-minute chart. Price pulls back into a demand zone at 1.0850. You enter long at 1.0855, stop at 1.0835 (20 pips), target at 1.0905 (50 pips). Price hits target. You make $500 at 1 standard lot.
Trade 2 (Wednesday): Same pair, same timeframe, same pattern. Bullish break of structure, pullback to demand at 1.0870. You enter at 1.0875, stop at 1.0855 (20 pips), target at 1.0925 (50 pips). Price wicks through the zone and stops you out. You lose $200.
The chart setup was identical. The outcome was opposite. A trader who thinks trading is chart reading will question their analysis. A trader who understands probability will record both trades, note that the process was correct both times, and move on.
Walkthrough: The Ego-Driven Override
Same trader, trade 3 (Friday). Another valid setup appears. But the trader is still stinging from Wednesday's loss. The chart says "enter." The ego says "you just got burned on this same setup two days ago."
The trader skips the trade. Price runs 65 pips in the planned direction. The analysis was right. The emotions overruled it.
This is the core problem: the gap between what you see on the chart and what you do with what you see. Chart reading gives you the plan. Psychology determines whether you follow it.
What Actually Separates Profitable Traders
If chart reading is not the differentiator, what is? Three things.
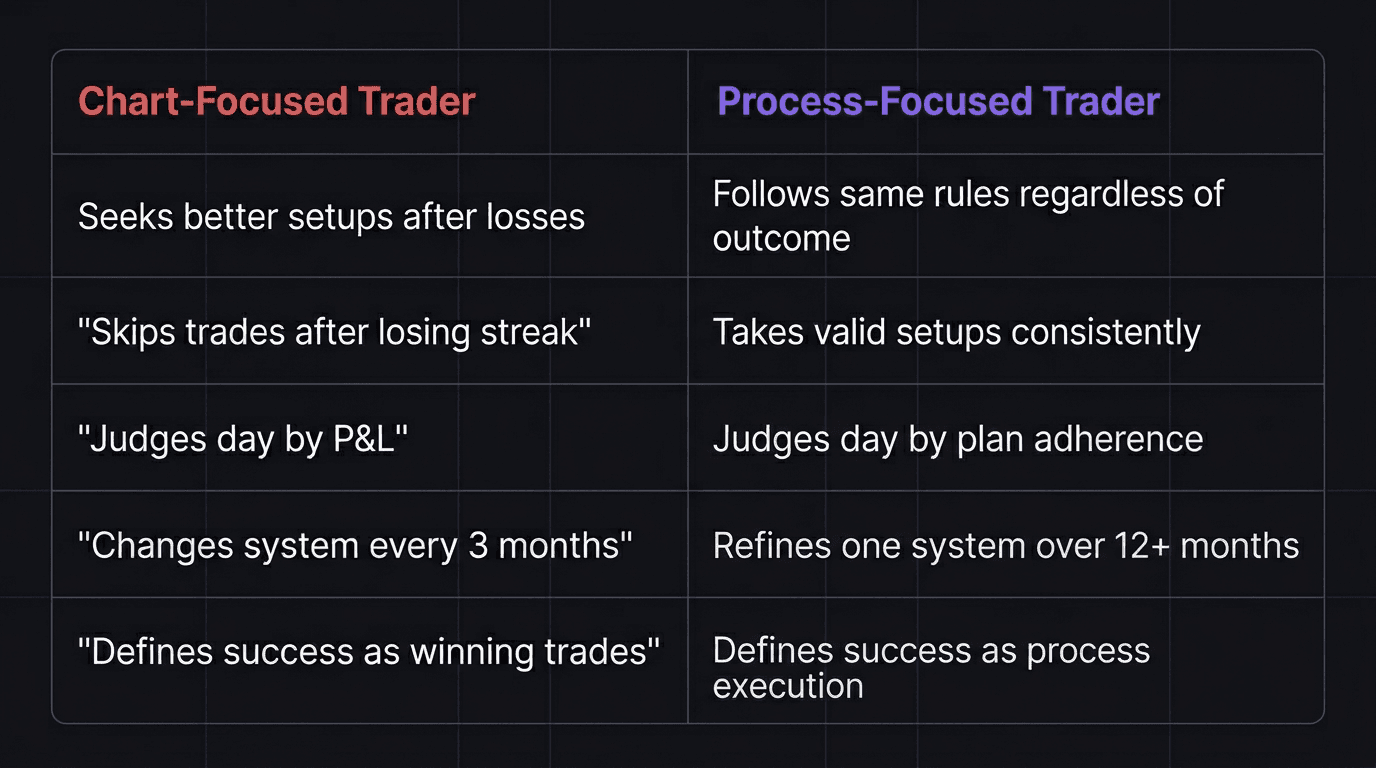
Execution consistency. Profitable traders take the same trades in the same way regardless of recent outcomes. They do not let a losing streak change their process. They do not let a winning streak inflate their risk. The plan is the plan.
Probabilistic acceptance. They genuinely believe (not just intellectually know) that any single trade can lose. This belief removes the emotional charge from individual outcomes. A loss is not a failure. It is a cost of doing business in a probabilistic game.
Process identity. They define themselves by their process, not their P&L. A good day is one where every trade followed the plan, even if the result was a loss. A bad day is one where they deviated from the plan, even if the result was a profit.
The Uncomfortable Work
The reason most traders stay stuck in the analysis loop is because chart reading feels productive. You can measure progress: "I learned a new pattern today." Working on execution consistency feels abstract and uncomfortable. There is no certification for sitting with the discomfort of a losing streak without changing your strategy.
But that uncomfortable work is the actual work of becoming profitable. It is sitting through a drawdown and not touching your lot size. It is watching a skipped trade run to target and not doubling your position on the next entry. It is reviewing your journal after a bad week and accepting what the data shows about your behavior.
Trading is a game of psychology and belief. The charts are the vehicle. The driver is everything.
How EdgeFlo Keeps the Focus on Process
EdgeFlo is built around the idea that execution quality matters more than analysis quality. The trading dashboard tracks discipline metrics alongside performance metrics, so you can see whether your results come from good process or lucky outcomes.
The Edge plan builder keeps your rules visible during live trading, not buried in a PDF or notebook. When emotions push you to deviate, your documented plan is right there on screen. It does not enforce the plan (you can always override), but it makes deviation a conscious choice rather than an unconscious reaction.
Can you be a good chart reader and still lose money trading?
What is more important than chart reading in trading?
Why do traders focus too much on charts?
Is technical analysis useless for trading?

Turn discipline on.
Every session.
EdgeFlo is the environment serious traders operate inside.
Start 7-Day Trial — $7
Cancel anytime.
No long-term commitment.


Think Different, Trade Different.