

Why Support and Resistance Gets You Trapped
Support and resistance levels are where retail traders get stopped out. Learn why institutions target these levels and what to use instead.

Support and resistance is the first trading concept most people learn. It is also the reason most of those people get stopped out of perfectly good trade ideas.
The problem is not that you identified the wrong level. The problem is that you, and thousands of other retail traders, identified the exact same level. Every stop loss clustered below that support line is a sell order waiting to be triggered. And the institutions that need those sell orders know exactly where they are.
TL;DR
Support and resistance levels are visible to everyone, making them predictable targets for liquidity sweeps.
Institutions drive price through these levels to trigger retail stops and collect the order flow they need.
The more times a level is tested, the more liquidity builds beneath it (or above it for resistance).
Supply and demand zones track where institutional orders originated, not where price bounced.
Trading after the sweep of a support/resistance level puts you on the institutional side of the move.
The Two Ways Support and Resistance Fails You
There is not just one way to get trapped. There are two, and they catch traders on opposite sides.
Trap 1: The false breakout. You are watching a resistance level at 1.0920. Price pushes above it. You enter a buy, thinking resistance has flipped to support. You place your stop below 1.0920. Price reverses, drops through 1.0920, and stops you out.
Trap 2: The stop hunt. You are watching a support level at 1.0850. You buy at 1.0855 and place your stop at 1.0840, just below support. Price dips to 1.0835, triggers your stop, then immediately reverses and rallies to 1.0920. Your trade idea was correct. Your entry and stop placement cost you the trade.
Both traps share the same root cause: you placed your orders where everyone else placed theirs. Institutions need the other side of those orders, so they engineer a move to trigger them.
Sound familiar? If you have experienced either scenario, you are not bad at trading. You are just using a tool that puts a target on your back. This is one of the most common trading mistakes that intermediate traders need to fix.
Why "Strong" Support Is Actually Weak
Here is the counterintuitive truth: the more times price bounces off a support level, the weaker it gets.
Most trading education says the opposite. "Price has bounced off 1.0850 four times. That is strong support." What that really means is that four rounds of retail traders have entered buys at 1.0850 and placed their stops below it. Each bounce adds more stop losses to the pool below that level.
By the fourth bounce, there is a massive concentration of sell orders (stop losses) sitting just below 1.0850. That is a liquidity magnet. The question is not if that liquidity gets swept. It is when.
Walkthrough: The "Strong Support" That Broke
EUR/USD has bounced off 1.0850 three times over two weeks on the 4-hour chart. Classic textbook support.
On the fourth test, a trader enters a buy at 1.0855. Stop loss at 1.0838 (17 pips). Take profit at 1.0920 (65 pips).
Price consolidates near 1.0850 for six hours. Then a quick move drops price to 1.0828, 22 pips below "strong support." The stop triggers at 1.0838.
Math check: 0.1 lots = $1/pip. $1 times 17 pips = $17 loss.
Over the next four hours, price rallies from 1.0828 to 1.0935. Not only did it reach the original target of 1.0920, it blew past it. The trade idea was solid. The entry method was the problem.
The 22-pip dip below support was the liquidity sweep. Institutions needed those clustered stop losses to fill their buy orders. Once the stops were triggered and absorbed, price had the fuel to move.
What Supply and Demand Zones Do Differently
Support and resistance tells you where price bounced. Supply and demand tells you where institutional orders originated. That is a critical difference.
A demand zone is the consolidation or origin candle before a strong impulse move upward. It marks the price area where large buyers first entered. When price returns to that area, those same buyers (or new institutional buyers at the same level) are expected to step in again.
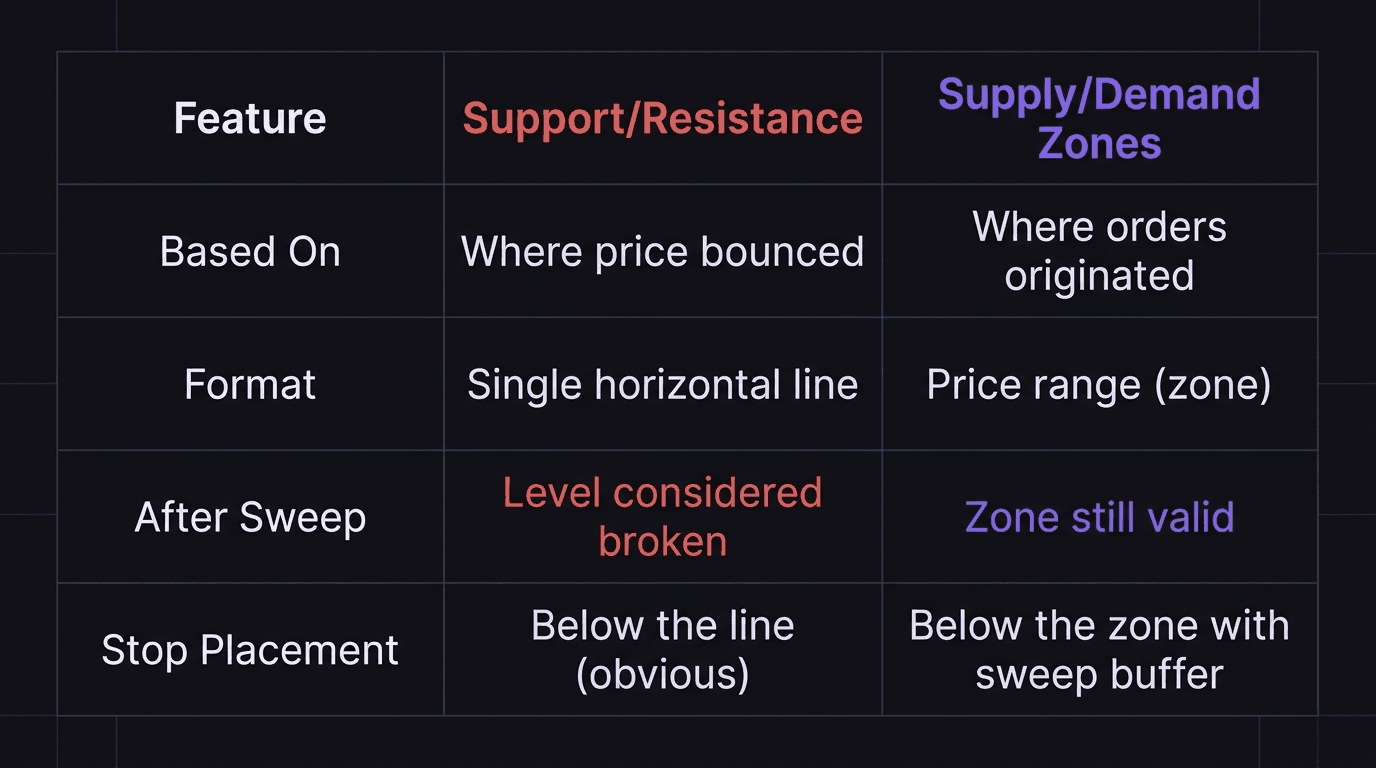
The key differences:
Support is a line. A demand zone is a range. A support line at 1.0850 gives you zero flexibility. A demand zone from 1.0840 to 1.0860 gives you a 20-pip area to work with, including room for the sweep.
Support is based on bounces. Demand is based on origin points. Support says "price bounced here before." Demand says "this is where the buying orders that caused the move originally came from." One is backward-looking. The other tracks institutional intent.
Support ignores sweeps. Demand expects them. When price breaks below a support level, the level is "broken" and traders flip their bias. When price sweeps below a demand zone, the zone is still valid because the sweep is part of the process, not a violation of it.
How to Trade After the Trap Instead of Inside It
The fix is not to stop looking at support and resistance levels. It is to use them as a map of where liquidity is building, then trade after that liquidity gets swept.
Step 1: Identify the obvious level. Where would most retail traders draw a support or resistance line? That is where their stops will be.
Step 2: Mark the demand or supply zone nearby. Use the origin candle or consolidation method to identify the institutional zone that sits near (but not exactly at) the support/resistance level.
Step 3: Wait for the sweep. When price drops through the support level and triggers the retail stops, watch what happens next. If price enters your demand zone and starts showing signs of reversal on the lower timeframe, the sweep is likely complete.
Step 4: Enter after confirmation. Use a market structure shift on the 15-minute chart as your entry signal. Price breaks the last lower high on the LTF, confirming that the sweep is done and buyers are taking control.
Walkthrough: Trading the Same Level the Right Way
Same EUR/USD setup. The visible support at 1.0850 has been tested three times. Your demand zone (using the pivot method) sits between 1.0835 and 1.0848.
Instead of buying at support, you wait. Price drops through 1.0850, triggering retail stops. It continues to 1.0832, sweeping below your demand zone extreme.
On the 15-minute chart, price makes a lower low at 1.0832, then pushes up to 1.0845, then makes a higher low at 1.0838. When price breaks above the last 15-minute lower high at 1.0848, you enter a buy.
Entry: 1.0850.
Stop loss: 1.0828 (22 pips, below the swept low).
Take profit: 1.0894 (44 pips, 2R).
Math check: 0.1 lots = $1/pip. $1 times 22 pips = $22 risk. $1 times 44 pips = $44 target. $44 / $22 = 2.0R.
You entered at the same price level (1.0850) that the trapped traders bought at. But you entered after the sweep, with confirmation, and with your stop below swept liquidity. Their stops got triggered. Yours sits in clean space.
When Support and Resistance Is Not the Problem
Fair point: some traders do profit with support and resistance. It is not universally broken. But the traders who use it successfully almost always add context that beginners skip:
They check higher timeframe direction before trading levels.
They wait for candlestick confirmation at the level instead of entering blindly.
They accept that the level will be swept sometimes and size positions accordingly.
They treat the level as a zone, not a line, giving themselves room.
Most of these additions effectively turn support and resistance into a simpler version of supply and demand analysis. The traders just do not call it that.
How EdgeFlo Helps You Break the Support/Resistance Habit
Switching from support and resistance to supply and demand is partly a knowledge shift and partly a habit shift. You know the right approach, but under pressure you revert to drawing horizontal lines and placing stops below them.
EdgeFlo's Edge plan builder lets you document your zone methodology (consolidation or pivot method) as part of your trade plan. Your entry criteria, including "wait for liquidity sweep" and "confirm market structure shift on LTF," stay visible during trade execution.
The trading journal tracks whether you followed your plan or took an unplanned entry at a support level. Over time, you can compare win rates and R:R between your planned demand zone entries and your unplanned support/resistance entries. The data usually tells a clear story.
Why does price break through support and resistance levels?
Is support and resistance completely useless?
What should I use instead of support and resistance?
How do I know if a support level will hold or break?

Turn discipline on.
Every session.
EdgeFlo is the environment serious traders operate inside.
Start 7-Day Trial — $7
Cancel anytime.
No long-term commitment.


Think Different, Trade Different.