

If You Can't Spot the Liquidity, You Are the Liquidity
Retail traders who don't understand liquidity become fuel for institutional moves. Learn the mindset shift from victim to observer and start seeing liquidity first.

There is an old poker rule: if you have been at the table for 30 minutes and you cannot figure out who the sucker is, you are the sucker.
Trading works the same way. If you cannot see where liquidity is hiding on the chart, your positions are probably the liquidity that institutions are using to fill their orders. Your stop losses are their entries. Your breakout buys are their exits.
This is not a conspiracy theory. It is how markets function at scale. And the good news is that the shift from being the liquidity to seeing the liquidity is not a technical skill you need years to learn. It is a psychological reframe that changes how you read every chart.
TL;DR
If you do not see the liquidity, your stop losses and entries are the liquidity institutions use.
Retail behavior is predictable: traders buy breakouts, sell double tops, and place stops at obvious levels.
Institutions exploit this predictability to fill large orders without moving the market.
Seeing liquidity first means asking "where are the stop losses?" before "where is the entry?"
This shift from pattern-first to liquidity-first thinking is the core upgrade.
What It Means to Be the Liquidity
Every trade needs a counterparty. When you buy, someone sells to you. When you place a stop loss, that stop is a pending market order waiting to be triggered.
When a large institution wants to buy 500 lots, they need 500 lots of selling pressure to absorb their order. Where does that selling pressure come from? From retail stop losses getting triggered. From retail traders selling at "resistance." From breakout traders who entered early and are now panicking.
Being the liquidity means your trades exist to serve someone else's position. You buy, and your buy order helps the institution sell. Your stop triggers, and your forced sell order helps the institution buy.
Here is how it plays out in practice:
You see equal lows and buy the "double bottom." Your stop goes below the lows. Institutions push price through your stop, collect your sell order, and then price reverses upward.
You see a breakout above resistance and buy. Your entry provides selling liquidity for institutions who are distributing at that price. Price reverses, and you are stuck holding a loss.
You enter at a demand zone on the first touch. An inducement sweep takes your stop, and the real move happens after you are already out.
Sound familiar? That is what being the liquidity feels like. You are consistently on the wrong side of the real move by a few pips and a few minutes.
How Retail Behavior Creates the Fuel Banks Need
The reason this works is that retail behavior is incredibly predictable. Institutions do not need to read your mind. They just need to know where you are likely to place orders.
Equal highs and equal lows. When equal highs or equal lows form, retail traders place trades in the direction of the pattern. Their stops cluster just beyond the equal levels. Institutions know this and target those clusters.
Round numbers. Support and resistance at round numbers (1.3000, 150.00, 1900.00) attract massive order clusters. Everyone places stops at the same round levels.
Consolidation boundaries. Range traders put stops above resistance and below support. The longer the range, the more stops accumulate. Institutions wait for the range to build, then sweep one side for fuel.
News events. Before major releases, traders stack pending orders above and below the pre-news range. The initial spike triggers those orders, providing institutional fill liquidity.
The common thread: wherever retail traders predictably cluster orders, institutions find liquidity to fill their positions.
Walkthrough: Being the Liquidity on EUR/USD
A beginner trader sees EUR/USD form equal lows at 1.0850 on the 1-hour chart. The textbook says buy at support. The trader buys at 1.0855 with a stop at 1.0840 (15-pip risk, $150 per standard lot at $10/pip). Price dips to 1.0835, stopping them out. Loss: $150. Within the next hour, price reverses from 1.0835 and rallies to 1.0920, an 85-pip move from the sweep low. The trader was right about direction but wrong about timing. Their stop loss was the liquidity that fueled the rally.
The trader made the right read. The market was bullish. But by placing a stop at the most obvious level, they became the fuel for the very move they predicted.
The Mindset Shift from Victim to Observer
The shift is simple to describe and hard to internalize: stop looking for entries first. Start looking for liquidity pools first.
Most traders look at a chart and think: "Where should I enter?" That question leads to pattern-matching, which leads to predictable behavior, which leads to being the liquidity.
The better question is: "Where are the stop losses?" Because wherever stops are clustered, price is likely headed there before the real move begins.
This reframe changes everything about how you analyze:
Old approach: "I see a double bottom. I will buy." Then you get stopped out when price sweeps the lows.
New approach: "I see equal lows. That means stop losses are below. I will wait for the sweep and trade the reaction."
Old approach: "Price broke resistance. I will buy the breakout." Then you get trapped in a fake breakout.
New approach: "Price broke resistance. That might be a sweep of the stops above. I will wait for confirmation before committing."
The information is the same. The chart is the same. The difference is the lens you are looking through. Pattern-first thinking makes you the liquidity. Liquidity-first thinking makes you the observer who trades the aftermath.
Walkthrough: Seeing Liquidity First on GBP/USD
GBP/USD on the 15-minute chart. Price forms three touches at 1.2700 (support) and three touches at 1.2740 (resistance). A pattern trader sells at 1.2738, placing a stop at 1.2758. A liquidity-first trader sees the range and thinks: "Stops are above 1.2740 and below 1.2700. I do nothing until one side gets swept."
Price breaks above 1.2740 to 1.2758, sweeping the sell stops. The pattern trader gets stopped out for a 20-pip loss ($200 per lot). Price then returns to the range and breaks below 1.2700 to 1.2688. The liquidity-first trader sees the second side get swept and looks for a short entry. They enter at 1.2695 after a 5-minute structure shift bearish. Stop at 1.2715 (20-pip risk, $200). Price drops to 1.2630, a 65-pip move. Reward: $650. R:R is 3.25.
Same chart. One trader was the liquidity. The other traded the liquidity event.
Practical Steps to Start Seeing Liquidity
You do not need a course or a proprietary indicator. You need a habit. Here are four steps:
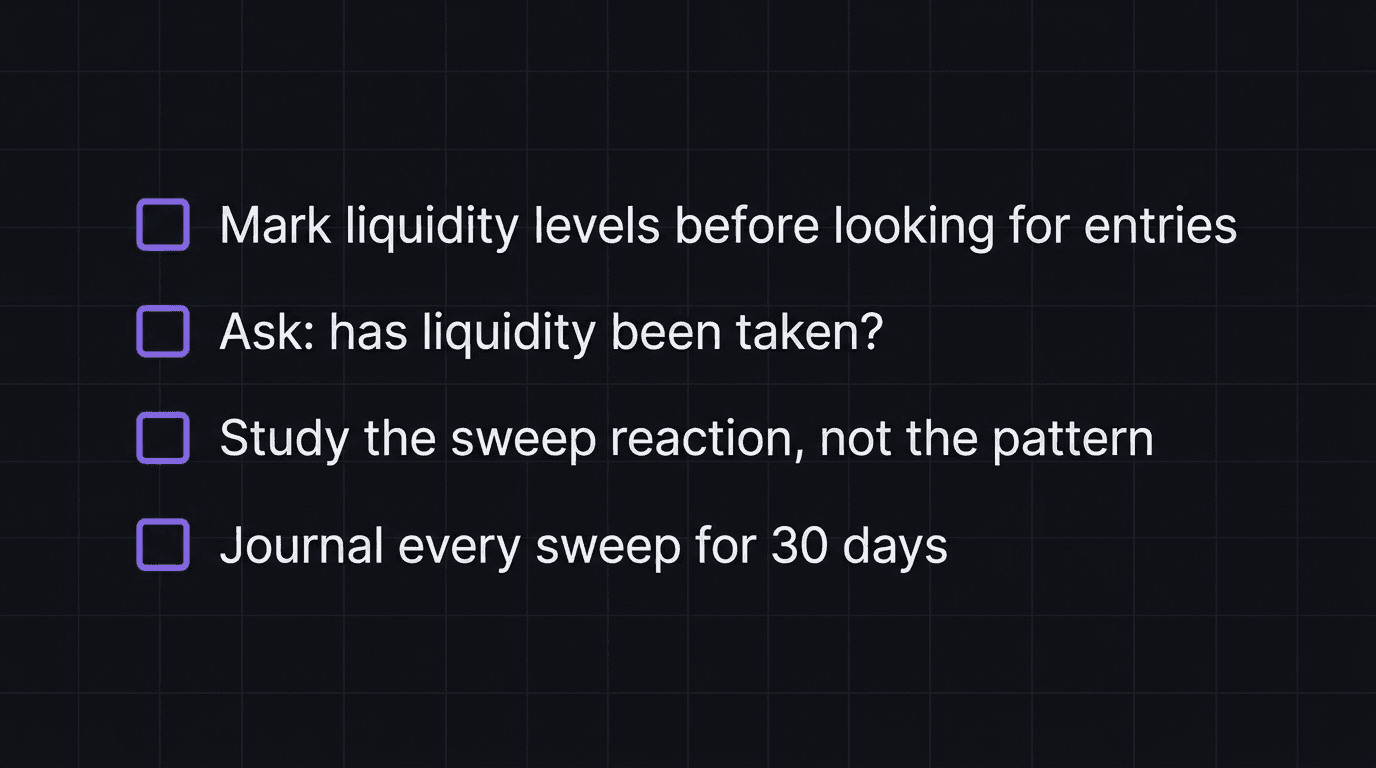
Step 1: Before looking for entries, mark the liquidity. On every chart you open, identify where stops would logically sit. Equal highs and lows, round numbers, consolidation boundaries, prior swing highs and lows. Draw them. Label them "buy-side liquidity" (stops above) and "sell-side liquidity" (stops below).
Step 2: Ask "has liquidity been taken?" before entering. If you want to enter long, check whether the sell-side liquidity below the current price has been swept. If it has not been swept, your entry is at risk of becoming the liquidity. Wait.
Step 3: Study the sweep, not the pattern. When price takes out a liquidity level, watch what happens next. Does price continue in the sweep direction (real breakout) or reverse (liquidity grab)? Train your eye on the reaction, not the level itself.
Step 4: Journal every sweep you see. Write down the level, whether it was swept, what happened after, and whether you traded it or not. After 30 days, you will have a personal dataset of how liquidity mechanics play out on the pairs and timeframes you trade.
This is not complex. It is pattern recognition with a different lens. And once you see it, you cannot unsee it.
How EdgeFlo Helps You Think Like an Institution
Shifting from pattern-first to liquidity-first thinking is a mental discipline. EdgeFlo supports that discipline at every stage.
FloAI (Plus plan) can surface observations about forming patterns and structural changes. When equal highs or equal lows build on your chart, it can flag them so you start thinking about where liquidity is accumulating rather than where to enter a pattern trade.
The trading journal with emotion tagging lets you record not just what you traded, but how you were thinking when you entered. Tag trades as "pattern entry" or "liquidity entry" and compare their performance over time. Most traders find a clear statistical edge when they entered after a sweep versus when they entered on a pattern.
The Edge plan builder keeps your rules visible during execution. If your rule says "no entries without a prior liquidity sweep," that rule sits on screen while you are tempted to chase. You can override it (override is always available), but the act of seeing it slows you down enough to ask the right question first.
Seeing liquidity is not about being smarter. It is about asking a different question before every trade. The tools help you ask it consistently.
What does it mean to be the liquidity?
How do retail traders become liquidity for institutions?
Can you learn to see liquidity on a chart?
Is the market really manipulated by banks?

Turn discipline on.
Every session.
EdgeFlo is the environment serious traders operate inside.
Start 7-Day Trial — $7
Cancel anytime.
No long-term commitment.


Think Different, Trade Different.