

Price Is Fractal: Why Timeframes Mirror
What happens on the higher timeframe must first happen on the lower timeframe. Learn how price fractality connects your 4H bias to your 15M entry.

Whatever happens on the higher timeframe must first happen on the lower timeframe. A 4-hour uptrend does not start by printing a bullish candle on the 4-hour chart. It starts with a series of bullish moves on the 15-minute chart that, when zoomed out, form that single 4-hour candle.
This is price fractality. The same patterns repeat at every scale. Higher highs and higher lows on the daily chart are made up of higher highs and higher lows on the 4-hour chart, which are made up of higher highs and higher lows on the 15-minute chart. Each layer builds the one above it.
Understanding this changes how you time entries, read pullbacks, and avoid trading against the structural current.
TL;DR
Price structure repeats on every timeframe: daily, 4-hour, 1-hour, 15-minute, 5-minute.
A pullback on the higher timeframe is a full trend on the lower timeframe.
The lower timeframe moves first. Higher timeframe moves are the result, not the cause.
Multi-timeframe analysis works because of fractality: you use the higher timeframe for direction and the lower timeframe for entry timing.
A lower timeframe market structure shift is the earliest signal that a higher timeframe pullback is ending.
What Fractality Looks Like in Practice
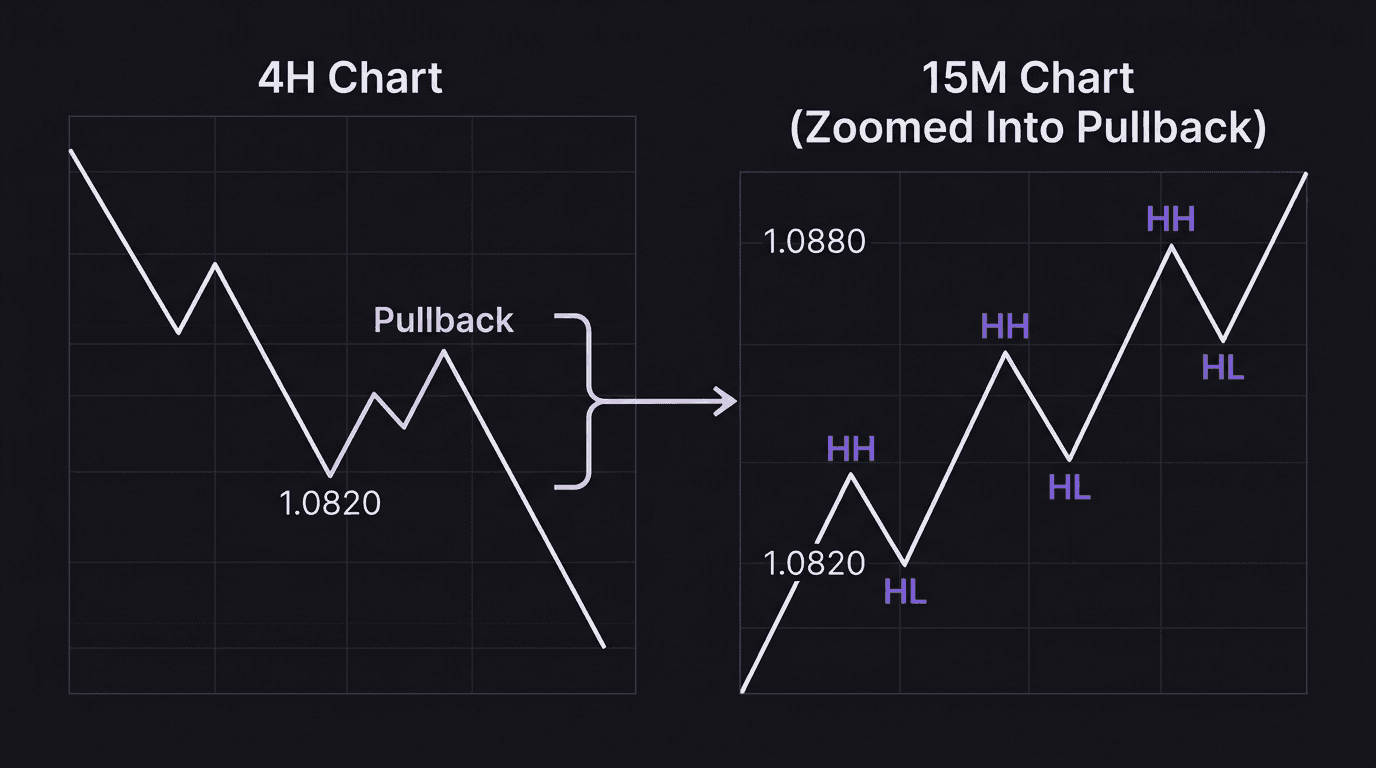
Open EUR/USD on the 4-hour chart during a downtrend. You see lower highs and lower lows. Price drops from 1.0950 to 1.0820, then pulls back to 1.0880 before dropping again.
That pullback from 1.0820 to 1.0880 looks like a minor retrace on the 4-hour chart. Maybe two or three candles. Nothing dramatic.
Now switch to the 15-minute chart and look at that same pullback period. You see a full uptrend: higher highs, higher lows, multiple swing points, consolidation zones, impulse moves. What was a small blip on the 4-hour is a tradeable trend on the 15-minute.
This is fractality at work. The 15-minute uptrend exists to facilitate the 4-hour pullback. When the 4-hour pullback is done, the 15-minute uptrend ends. And that ending (the 15-minute structure shifting from bullish to bearish) is your signal that the 4-hour downtrend is about to resume.
Why the Lower Timeframe Moves First
Here is the part that clicks once you see it. The 4-hour chart does not "cause" the 15-minute chart to move. It is the other way around.
Every 4-hour candle is made up of 16 fifteen-minute candles. The 4-hour candle does not decide to be bullish. It is bullish because the majority of those sixteen 15-minute candles moved price upward.
So when the 4-hour downtrend is about to resume after a pullback, the first sign does not appear on the 4-hour chart. It appears on the 15-minute chart. The 15-minute structure shifts from higher highs and higher lows (the pullback trend) to lower highs and lower lows (the resumption of the macro downtrend).
This is why you use the lower timeframe for entries. By the time the 4-hour chart confirms the pullback is over, you have already missed 30 to 50 pips of the move. The 15-minute chart showed you the shift hours earlier.
The Three-Timeframe Framework
Fractality is not just an observation. It is the foundation of multi-timeframe analysis. Most traders use three timeframes:
Higher timeframe (4-hour): Determines direction. Is the trend up, down, or sideways? This is your bias. You do not take entries on this timeframe.
Medium timeframe (1-hour): Identifies zones. Where are the supply and demand zones that institutions care about? Where should price pull back to before continuing?
Lower timeframe (15-minute): Times entries. When does the pullback end? When does the structure shift confirm the resumption of the higher timeframe trend?
Each timeframe answers a different question, and fractal structure is what makes those answers consistent with each other.
Walkthrough: Using Fractality to Time a Sell Entry
The 4-hour chart on GBP/USD shows a downtrend. Lower highs, lower lows. The last swing high was at 1.2680, and price is pulling back up from the swing low at 1.2540.
On the 1-hour chart, you identify a supply zone between 1.2650 and 1.2665. This is where institutional sellers stepped in previously. You wait for price to reach this zone.
Price enters the supply zone at 1.2655. You drop to the 15-minute chart.
On the 15-minute, price has been in an uptrend (facilitating the 4-hour pullback). You see higher highs and higher lows. You are watching for the internal structure to shift bearish: price needs to break below the last higher low on the 15-minute chart.
The last higher low on the 15-minute is at 1.2640. Price drops and closes below 1.2640. Structure shift confirmed. The 15-minute trend has changed from bullish to bearish. The 4-hour pullback is likely over.
You enter a sell at 1.2638.
Stop loss: 1.2668 (30 pips above entry, above the supply zone). Take profit: 1.2578 (60 pips below entry, 2R, targeting near the previous swing low).
Math check: 0.1 lots on GBP/USD = $1/pip. $1 times 30 pips = $30 risk. $1 times 60 pips = $60 target. $60 / $30 = 2.0R.
The 4-hour chart told you to sell. The 1-hour chart told you where. The 15-minute chart told you when. That is fractality applied.
Common Fractality Mistakes
Mistake 1: Trading the lower timeframe against the higher timeframe.
You see a beautiful uptrend on the 15-minute chart and enter long. But the 4-hour chart is in a downtrend, and this 15-minute uptrend is just the pullback. When the pullback ends, your long gets destroyed.
The 15-minute uptrend during a 4-hour downtrend is serving the pullback. It is not a new trend. Always check the higher timeframe context.
Mistake 2: Ignoring the lower timeframe shift.
You know the 4-hour is bearish and price has reached your supply zone. You enter a sell immediately without checking the 15-minute chart. But the 15-minute is still making higher highs, meaning the pullback is not done. Price runs another 25 pips against you before finally reversing.
The lower timeframe shift tells you when the pullback is actually ending. Skipping it means guessing at timing.
Mistake 3: Using timeframes that are too close together.
Using the 1-hour and the 30-minute as your "higher" and "lower" timeframes gives you almost the same information twice. You need enough separation so that the lower timeframe shows real structure within the higher timeframe moves. A ratio of 4x to 6x between timeframes works well: 4-hour and 1-hour (4x), 1-hour and 15-minute (4x).
Walkthrough: What Happens When You Ignore Fractality
A trader sees EUR/USD at 1.0870 on the 15-minute chart, making higher highs. They enter long with a 15-pip stop and a 30-pip target.
But the 4-hour chart shows a clear downtrend with the current move being a pullback. The 15-minute uptrend is just the pullback phase.
Price continues up to 1.0882, gets within 3 pips of the target, then reverses hard. The pullback was over. The 4-hour downtrend resumed. Price drops through the entry, triggers the stop at 1.0855, and continues falling.
Math check: 0.1 lots = $1/pip. $1 times 15 pips = $15 loss.
The trade was technically correct on the 15-minute chart. But the market structure on the 4-hour chart was telling the opposite story. Fractality means the higher timeframe wins. Always.
How EdgeFlo Helps You Trade With Fractal Awareness
The challenge with fractal trading is keeping track of multiple timeframes without losing context. You check the 4-hour, drop to the 1-hour, drop to the 15-minute, and by the time you find your entry, you have forgotten what the 4-hour was doing.
EdgeFlo's Edge plan builder lets you document your higher timeframe bias, your zone levels, and your lower timeframe entry criteria before the trade. When you are on the 15-minute chart waiting for the structure shift, your plan showing the 4-hour direction is visible right next to your chart. You do not have to hold it all in your head.
The trading journal then records which timeframes you actually used for each trade, letting you review whether you followed your multi-timeframe process or skipped a step. Over time, that feedback loop shows you exactly where your fractal analysis breaks down.
What does price fractality mean in trading?
How does the lower timeframe affect the higher timeframe?
Which timeframes should I use for fractal analysis?
Can I trade the lower timeframe against the higher timeframe trend?

Turn discipline on.
Every session.
EdgeFlo is the environment serious traders operate inside.
Start 7-Day Trial — $7
Cancel anytime.
No long-term commitment.


Think Different, Trade Different.