

Impulse and Consolidation: Why Price Alternates
Price moves in two repeating phases: impulse (momentum) and consolidation (rebalance). Learn why markets alternate, how to identify each phase, and when to trade.

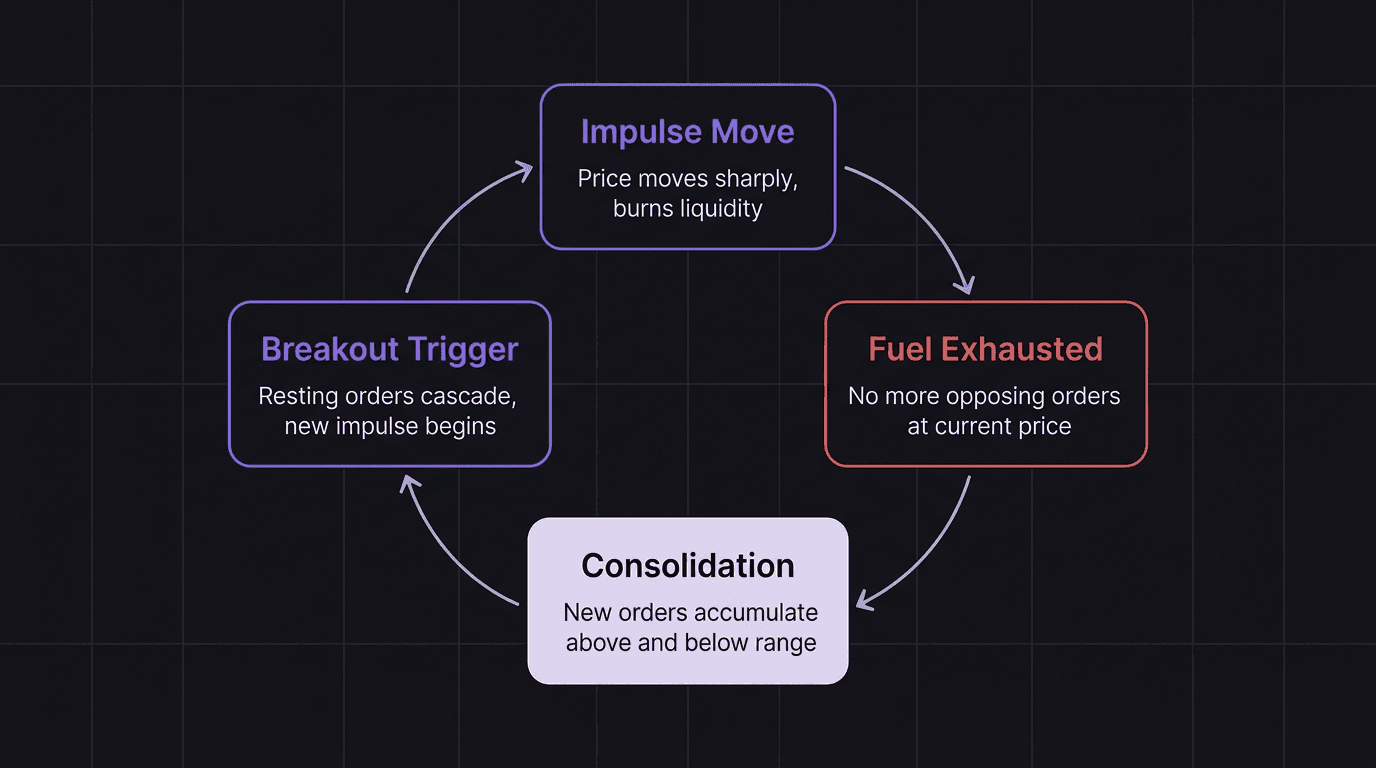
Price moves in two alternating phases: impulse and consolidation. An impulse is a sharp, directional move with momentum. A consolidation is a sideways pause where the market rebalances. These two phases repeat endlessly because the market needs liquidity to fuel every move, and that fuel runs out. Understanding which phase you are in right now is one of the most practical skills you can build as a trader.
Every market alternates between impulse (sharp directional moves) and consolidation (sideways pauses).
Impulse phases exhaust the available liquidity, forcing price to pause.
Consolidation phases build new pools of resting orders that fuel the next impulse.
Enter during consolidation for better risk-to-reward. Avoid chasing impulse moves.
Recognizing the current phase prevents premature entries and frustrating chop trades.
The Two Phases Every Market Cycles Through
Open any chart on any timeframe and you will see the same pattern: a strong move, then a pause. Another strong move, then another pause. It does not matter if it is EUR/USD on the 5-minute chart or the S&P 500 on the weekly. The cycle is always the same.
Impulse phase: Price moves with conviction. Candles are large, mostly one-directional, and close near their extremes. There is urgency. One side is in clear control.
Consolidation phase: Price moves sideways. Candles are smaller, overlapping, and indecisive. Neither buyers nor sellers have enough conviction to push price out of the range. The market is resting.
If you have ever sat through a boring, choppy afternoon session after an explosive morning move, you have experienced this cycle firsthand. The morning was the impulse. The afternoon was the consolidation. They are inseparable.
Why Price Needs to Pause Before Moving
Think about a car on a long road trip. It cannot drive from New York to Los Angeles on a single tank of fuel. It needs to stop at gas stations along the way. Each stop is a pause, not a destination. Refuel, then continue.
The market works the same way. An impulse move burns through available orders. Buyers keep buying until there are no more sellers willing to sell at the current price. When the sellers dry up, the move stalls. Not because the trend is over, but because the fuel is spent.
During consolidation, new orders accumulate. Traders who missed the impulse set limit orders. Traders who rode the impulse tighten their stops. New participants enter with pending orders at both edges of the range. This creates fresh pools of liquidity above and below the consolidation.
When one of those pools gets triggered, the next impulse begins. The break of structure out of a consolidation range is often the moment when resting orders cascade and a new momentum leg launches.
The Gas Station Analogy for Liquidity
The gas station comparison is worth sitting with because it clarifies something most traders get wrong. They see consolidation as "the market doing nothing." It is the opposite. Consolidation is the market doing the most important thing: building the fuel supply for the next leg.
Every impulse leg needs opposing orders to absorb. A bullish impulse needs sell orders to buy from. Those sell orders build up during consolidation as traders place stops below the range, limit sell orders at the top of the range, and bearish entries at resistance.
When the consolidation ends and price breaks out to the upside, it is burning through that accumulated sell liquidity. The move is only as powerful as the fuel supply. A thin consolidation with few resting orders produces a weak breakout. A deep, extended consolidation with heavy order accumulation produces an explosive move.
Walkthrough: Impulse to consolidation to impulse on EUR/USD. EUR/USD drops sharply from 1.0900 to 1.0820 during the London session, an 80-pip impulse. Then it spends the next 8 hours trading between 1.0820 and 1.0845, a tight 25-pip consolidation range. During those 8 hours, buyers place stops below 1.0820, shorts place stops above 1.0845, and new limit orders stack at both edges. The next morning, price breaks below 1.0820, sweeps the stops, and drops another 60 pips to 1.0760. The consolidation was not a pause. It was a reload. The fuel built during those 8 boring hours powered the next impulse leg.
How to Tell Which Phase You Are In
The distinction is usually obvious if you step back and look at the last 20 to 30 candles on your chart.
Signs you are in an impulse: Large candles closing near their extremes. Minimal overlap between consecutive candles. Price covering ground quickly. If you zoom out, the section looks like a steep slope.
Signs you are in consolidation: Small candles with long wicks. Heavy overlap between consecutive candles. Price bouncing between two levels. If you zoom out, the section looks like a flat box.
The mistake traders make is trying to trade consolidation like an impulse. They enter a breakout at the edge of the range, and price immediately pulls back into the middle. They try to ride a pullback and get chopped up in sideways action.
Walkthrough: Wrong phase, wrong trade. Trader opens the GBP/USD 15-minute chart and sees price break above a resistance level at 1.2680. They buy immediately, expecting an impulse leg. But the 4H chart shows price sitting in the middle of a consolidation range between 1.2650 and 1.2710. The "breakout" on the 15m was just noise within the bigger consolidation. Price moves to 1.2695 and reverses back to 1.2665. Trader gets stopped out. The fix: check the higher timeframe first. If the higher timeframe is in consolidation, do not chase breakouts on the lower timeframe.
How EdgeFlo Tracks Your Phase Recognition
Recognizing phases is a skill that improves with feedback, not just screen time. You need to know whether the trades you take are aligned with the current phase or fighting against it.
EdgeFlo's journal lets you tag each trade with context. After your session, review whether your entries happened during impulse moves (chasing) or during consolidation setups (patient). Over a week, this data reveals whether you have a phase recognition problem or an execution problem.
The dashboard analytics show your win rate and average R broken down by the tags you create. If "consolidation entry" trades average 2.5R and "impulse chase" trades average 0.4R, the data makes the decision obvious. Stop chasing impulse moves. Wait for consolidation setups. The journal creates the feedback loop that turns a concept into a habit.
What is an impulse move in trading?
What is a consolidation phase?
Why does the market alternate between impulse and consolidation?
Should I trade during impulse or consolidation?

Turn discipline on.
Every session.
EdgeFlo is the environment serious traders operate inside.
Start 7-Day Trial — $7
Cancel anytime.
No long-term commitment.


Think Different, Trade Different.