

How Traders Blow Their Accounts (The Survival Math)
The math behind blown accounts: risk 2 percent and face a 23 percent wipeout chance. Risk 0.5 percent and drop it to 0.1 percent. See the numbers.

Traders blow their accounts because they risk too much per trade and run out of capital before their strategy has time to work. At 2% risk per trade with a 30% win rate and 1:5 reward ratio, Monte Carlo simulations show a 23% probability of total account loss over 30 trades. Drop the risk to 0.5% per trade with the same strategy, and that probability falls to 0.1%. The difference between survival and wipeout is not the strategy. It is the position size.
Every trader faces losing streaks. The question is whether your account can absorb them. If you risk 50% per trade, two losses end you. Risk 10%, and five losses end you. Risk 1%, and you get 100 chances. Risk 0.5%, and you get 200. This is not a feel-good lecture about patience. It is arithmetic.
TL;DR
Risk per trade determines how many consecutive losses your account can absorb before reaching zero.
At 2% risk per trade (30% win rate, 1:5 R:R, 30 trades), total loss risk is 23%. Roughly one in four accounts blows.
At 1% risk, total loss risk drops to 3%. At 0.5% risk, it drops to 0.1%.
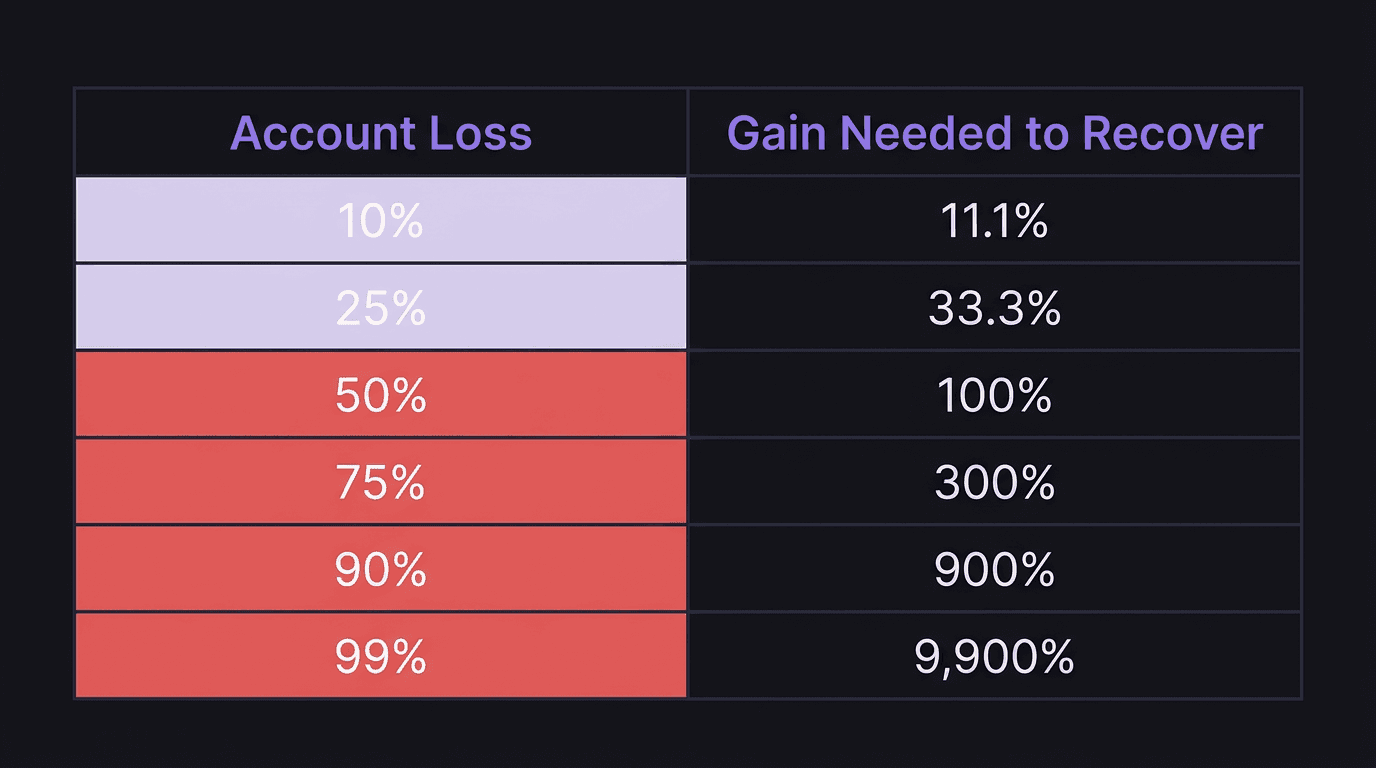
Losing 50% of your account requires a 100% gain to recover, not 50%.
The survival edge is position sizing, not strategy selection.
The Bullet Analogy
Think of every trade as a bullet. Your risk per trade determines how many bullets you carry into the market each day, week, and month.
Risk 50% per trade = 2 bullets
Risk 20% per trade = 5 bullets
Risk 10% per trade = 10 bullets
Risk 5% per trade = 20 bullets
Risk 1% per trade = 100 bullets
Risk 0.5% per trade = 200 bullets
If you run out of bullets, you cannot win. It does not matter how good your aim is, how clean your strategy is, or how well you read the chart. Zero capital means zero trades. Game over.
Every professional trader understands this: the primary job is survival. Profits come from survival. If you blow your account in month two, you will never collect the profits your strategy would have generated in months three through twelve.
The Recovery Trap
This is the math that most beginners skip, and it explains why drawdowns become death spirals.
If you lose 10% of your account, you need an 11.1% gain to get back to even. That is doable. Uncomfortable, but doable.
If you lose 25%, you need 33.3% to recover. Harder.
If you lose 50%, you need 100% to recover. You need to double your remaining capital just to break even.
If you lose 75%, you need 300% to recover. At that point, you are not recovering. You are starting over.
This asymmetry is why large drawdowns are account killers. The deeper you go, the harder it is to climb out. A trader who loses 50% of a $10,000 account now has $5,000 and needs to make $5,000, which is a 100% return on the remaining balance. Most professional fund managers consider a 20% annual return excellent. A 100% return is not a recovery plan. It is a fantasy for most traders.
The fix is upstream: never get to 50% drawdown in the first place. And the only reliable way to prevent it is to control risk per trade.
Simulation Data: Three Risk Levels
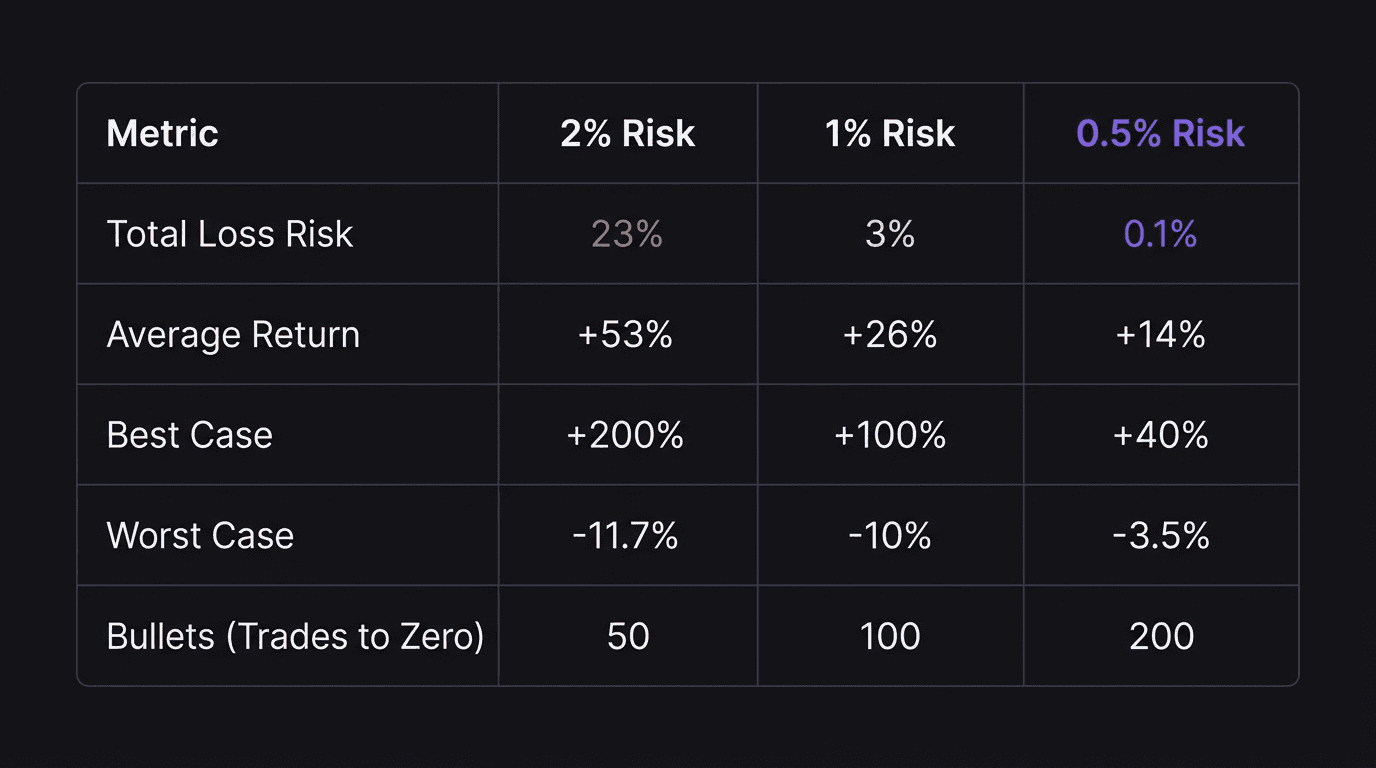
Same strategy across all three scenarios: 30% win rate, 1:5 risk-to-reward ratio, $100,000 account, 100 simulation runs. The only variable is risk per trade.
High Risk: 2% Per Trade (30 trades)
Total loss risk: 23%
Average performance: +53%
Minimum performance: negative 11.7%
Maximum performance: +200%
The average is tempting. +53% over 30 trades sounds incredible. But one in four simulations ends in total wipeout. And the minimum performance (negative 11.7%) requires roughly a 13% gain just to recover.
Sound familiar? This is the trap. Traders see the upside and ignore the ruin probability. They focus on the +53% average and do not process that 23% means roughly one in four paths leads to zero.
Moderate Risk: 1% Per Trade (30 trades)
Total loss risk: 3%
Average performance: +26%
Minimum performance: negative 10%
Maximum performance: +100%
Better. The total loss risk dropped from 23% to 3%. Average performance is lower (+26% vs +53%), but that is the trade-off. You gave up some upside to dramatically reduce the chance of losing everything.
Low Risk: 0.5% Per Trade (30 trades)
Total loss risk: 0.1%
Average performance: +14%
Minimum performance: negative 3.5%
Maximum performance: +40%
At 0.5% risk, the total loss risk is essentially zero. The worst-case outcome across all simulations is a 3.5% drawdown. That is recoverable in a few good trades. And 14% average over 30 trades (roughly one month at 3 to 5 trades per week) is a strong, sustainable result.
How Accounts Actually Die
Blown accounts rarely happen from one bad trade (unless the trader has no stop loss). They die through a sequence:
Oversized risk per trade. The trader risks 5% or 10% per position because they want faster growth.
A losing streak arrives. Three, four, five losses in a row. This is statistically normal with a 30% win rate, but it hits the account hard when each loss is 5% or more.
Drawdown triggers emotional response. The trader, now down 20% or 30%, starts revenge trading. Larger positions to "make it back." More frequent entries on weaker setups.
The spiral accelerates. Bigger losses compound the drawdown. Recovery becomes mathematically unrealistic. The account crosses a point of no return.
Blow up or quit. Either the account hits zero, or the trader walks away from what remains.
This sequence repeats across almost every blown account. The entry point is always the same: risk per trade was too high. If the initial risk had been 0.5% instead of 5%, the losing streak would have cost 2.5% instead of 25%. No emotional spiral. No revenge trading. No blow up.
Walkthrough: The 5% Risk Spiral on EUR/USD
A trader starts with a $10,000 account, risking 5% ($500) per trade on EUR/USD.
Trade 1: Sell EUR/USD at 1.0900, stop at 1.0940 (40 pips). Lot size: $500 / (40 pips times $10/pip per lot) = $500 / $400 = 1.25 lots. Close to 1.25 lots. Loss: $500. Balance: $9,500.
Trade 2: Still confident. Risk 5% of $9,500 = $475. Another loss. Balance: $9,025.
Trade 3: Frustrated. "I need to make it back." Risks 5% = $451. Loss. Balance: $8,574.
Trade 4: Full tilt. Increases to 10% risk ($857). Loss. Balance: $7,717.
Trade 5: Desperation. Risks 15% ($1,158). Stops out. Balance: $6,559.
Five trades. Down 34% in what might have been a single week. Recovery requires a 52% gain. The strategy might have been fine. The sizing was the killer.
Now imagine that same week at 0.5% risk. Five losses cost $50, $49.75, $49.50, $49.26, $49.01. Total: roughly $247.50. Account balance: approximately $9,752. Recovery needed: about 2.5%. That is one good trade.
Same losing streak. Same strategy. Same five trades. One trader is down 34% and spiraling. The other is down 2.5% and barely noticed.
The Question That Prevents Account Failure
Before you set your risk per trade, ask this: would an investor trust their money with you?
Look at your equity curve. If it shows a smooth, slightly upward trajectory with manageable dips, an investor would say yes. If it shows wild swings, deep drawdowns, and recovery attempts that never quite work, they would walk away.
You are that investor. Your trading capital is money you earned from hours of work. Treat it with the same seriousness a fund manager treats client capital. That means risking 0.5% to 1% per trade, setting a daily loss limit, and refusing to increase position size after a loss.
The professional trader's edge is not a secret pattern or special indicator. It is the discipline to risk small, survive losing streaks, and let the math compound over hundreds of trades. If your lot size is too big for your account balance, the best strategy in the world will not save you.
How EdgeFlo Protects Against the Spiral
EdgeFlo's guardrail system is built around the exact failure sequence described above. You set your maximum risk per trade, and EdgeFlo calculates the correct lot size before every entry. If you try to oversize a position beyond your rule, it flags the trade and makes you confirm the override.
The daily loss limit feature stops you from trading after a set number of consecutive losses or a percentage drawdown for the day. You can override it (your account, your choice), but you have to actively choose to keep trading. That moment of friction is often enough to break the revenge-trading cycle.
After each session, your journal shows every trade in R multiples, making it easy to see whether you followed your sizing rules or deviated. Over time, the dashboard reveals whether your drawdowns are within normal statistical range or signal a sizing problem that needs correction.
How fast can you blow a trading account?
What percentage of traders blow their accounts?
How much should you risk per trade to avoid blowing up?
Can you recover from a 50% account drawdown?

Turn discipline on.
Every session.
EdgeFlo is the environment serious traders operate inside.
Start 7-Day Trial — $7
Cancel anytime.
No long-term commitment.


Think Different, Trade Different.