

Data Over Feelings: How to Make Trading Decisions From Your Journal
Stop trusting gut feelings. Use your journal data to kill losing habits, keep winning patterns, and replace emotion with statistical proof.

Nobody cares what you feel about a setup. Not the market, not your broker, and definitely not your account balance. What matters is what actually makes money. Your journal holds that answer, if you know how to read it. Most traders collect journal entries like receipts in a shoebox. They never go back, never filter, never compare. The data sits there, unused, while they keep making the same mistakes based on gut feelings.
TL;DR
Gut feelings are unreliable because your brain overweights recent events and ignores base rates.
Your journal data reveals which setups, sessions, and behaviors actually produce profit.
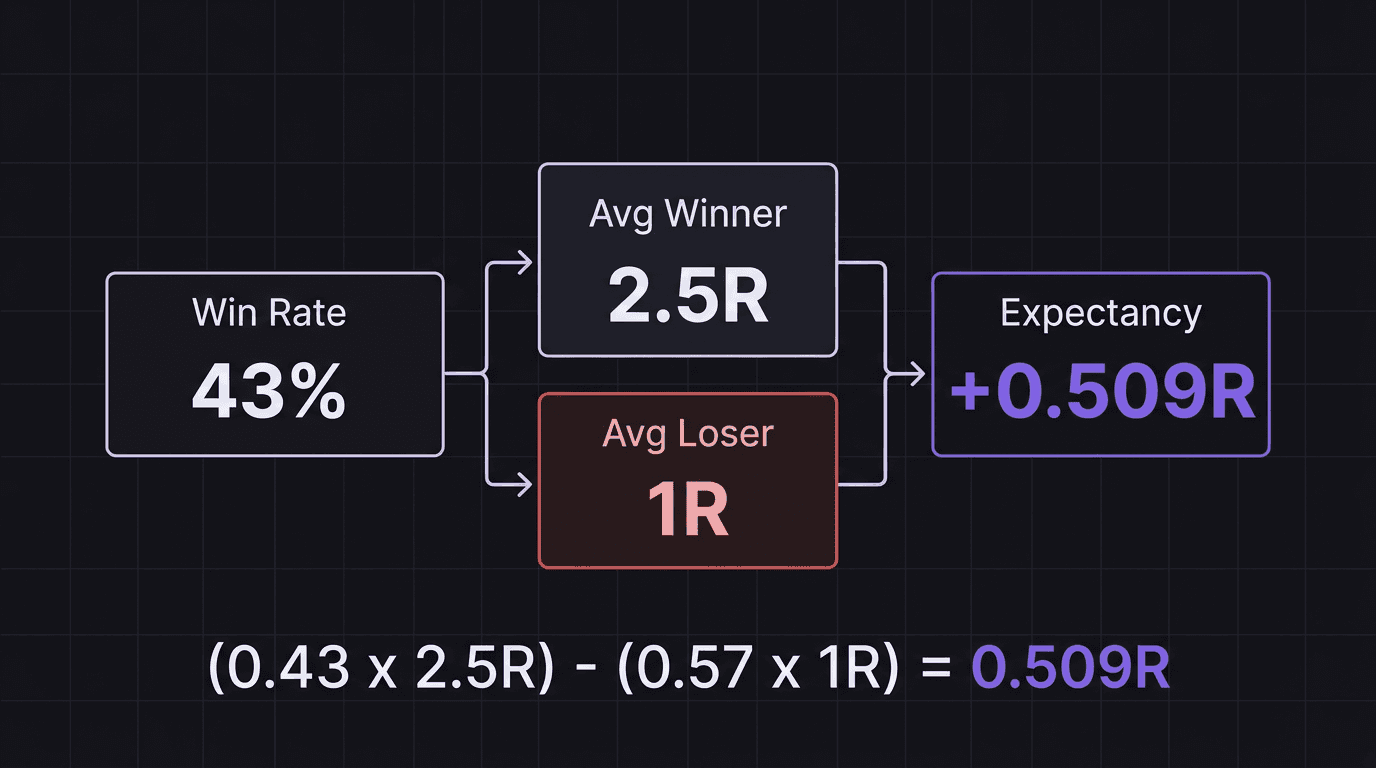
Track three core metrics: win rate, average R-multiple, and expectancy.
Use filtered data to make three specific decisions: what to cut, what to keep, and what to test next.
Replace every emotional trading decision with a data-backed rule.
Why Feelings Lie and Data Does Not
Your brain is not built for trading. It is built for survival, which means it overreacts to losses, underreacts to slow gains, and remembers the last three trades more vividly than the last 100.
After three consecutive losses, you feel like your strategy is broken. But your data might show a 42% win rate over 200 trades, right in line with a profitable system. After a big winner, you feel invincible. But your data might show that your next trade after a big win has a 60% chance of being a loss because you get sloppy.
Feelings respond to sequences. Data responds to samples. A coin that lands heads three times in a row has not changed its probability. Your strategy that loses three times in a row has not changed its edge. But your feelings will tell you otherwise. Every time.
This is why the most important habit in trading is not finding better setups. It is building the discipline to override your feelings with your data. Your trading journal is the tool that makes this possible.
The Recency Trap
Ever changed your entry method after a bad week, even though the method was profitable over three months? That is the recency trap. Your brain gave more weight to the last five trades than to the previous 200. The data said "keep going." Your feelings said "something is wrong."
The fix is not willpower. The fix is a rule: no changes to your plan until you have 100 trades on the current setting. Write that rule down. Follow it even when it hurts.
Three Decisions Your Journal Data Should Make for You
Your journal is not a diary. It is a decision engine. Here are the three decisions it should make for you, removing feelings from the equation entirely.
Decision 1: What to Cut
Filter your journal by session. If Asian session trades have a negative expectancy over 50 trades while London session trades are positive, cut Asian session from your plan. You do not need to feel bad about it or wonder if Asian session "might work eventually." The data said no. Move on.
Do the same for pairs, entry types, days of the week, and any other variable you tag. If a filter shows negative expectancy, cut it.
Walkthrough: Cutting What Loses
You review 120 trades in your journal. You filter by session:
London (65 trades): 28 wins, 37 losses. Average winner: 2.5R. Average loser: 1R. Win rate: 28 / 65 = 43.1%. Expectancy: (0.431 x 2.5R) + (0.569 x -1R) = 1.078R + (-0.569R) = 0.509R.
Math check: 28 / 65 = 0.4308, rounds to 43.1%. Correct. 0.431 times 2.5R = 1.078R. Correct. 0.569 times 1R = 0.569R. Correct. 1.078R minus 0.569R = 0.509R. Correct.
New York (35 trades): 11 wins, 24 losses. Average winner: 1.8R. Average loser: 1R. Win rate: 11 / 35 = 31.4%. Expectancy: (0.314 x 1.8R) + (0.686 x -1R) = 0.565R + (-0.686R) = -0.121R.
Math check: 11 / 35 = 0.3143, rounds to 31.4%. Correct. 0.314 times 1.8R = 0.565R. Correct. 0.686 times 1R = 0.686R. Correct. 0.565R minus 0.686R = -0.121R. Correct.
Asian (20 trades): 5 wins, 15 losses. Average winner: 1.2R. Average loser: 1R. Win rate: 5 / 20 = 25%. Expectancy: (0.25 x 1.2R) + (0.75 x -1R) = 0.3R + (-0.75R) = -0.45R.
Math check: 5 / 20 = 0.25 = 25%. Correct. 0.25 times 1.2R = 0.3R. Correct. 0.75 times 1R = 0.75R. Correct. 0.3R minus 0.75R = -0.45R. Correct.
The decision is clear: cut Asian session trades immediately. New York is marginal and should be monitored for another 50 trades or cut now. London is your edge. Focus there.
Decision 2: What to Keep
The flip side of cutting losers is doubling down on winners. If your journal shows that a specific setup type (say, demand zone entries after a liquidity sweep) has a 0.8R expectancy versus 0.3R for all other setups, you want more of those high-expectancy trades.
This does not mean forcing them. It means structuring your session around finding them. Sit out if the sweep setup is not present. Your data already told you that the other setups are worth less per trade.
Decision 3: What to Test Next
Your journal also reveals gaps. If you have 150 London session trades but only 30 Asian session trades, you do not have enough data to conclude anything about Asian session yet. The data says "collect more" before deciding.
Look at your variable tags. Which ones have sample sizes under 50? Those are the variables you need to test next. Prioritize the variable that would have the largest impact on your results if the test reveals a difference.
How to Read Your Win Rate, R-Multiple, and Expectancy Together
These three metrics tell different stories. Reading them individually is useful. Reading them together is powerful.
Win rate alone is dangerous. A 70% win rate sounds great until you realize the average winner is 0.5R and the average loser is 1R. Expectancy: (0.7 x 0.5) + (0.3 x -1) = 0.35 + (-0.3) = 0.05R. Barely positive. One bad trade wipes out the edge.
R-multiple alone is misleading. An average winner of 5R sounds incredible until you realize the win rate is 15%. Expectancy: (0.15 x 5) + (0.85 x -1) = 0.75 + (-0.85) = -0.1R. Negative expectancy despite huge winners.
Expectancy is the truth. It combines win rate and R-multiple into a single number that tells you whether you have an edge. Positive expectancy means your strategy makes money over time. Negative expectancy means it does not, no matter how good individual trades feel.
Check your expectancy on your trading dashboard after every 25 trades. If it is trending down, something changed. Check your filters. If it is stable and positive, you have an edge. Protect it by not changing what works.
Killing What Loses, Keeping What Wins
The hardest part of data-driven trading is acting on what the data says when it contradicts how you feel. Your favorite session might be a loser. Your least favorite setup might be your most profitable one.
You might love trading GBP/JPY because it moves fast and feels exciting. But your journal shows a -0.3R expectancy on GBP/JPY and a +0.6R expectancy on EUR/USD. The data says stop trading GBP/JPY. Your feelings say "but the big moves are there."
The data wins. Every time.
Here is a process for acting on your data quarterly:
Export or review your last 100 trades.
Filter by every major variable: pair, session, entry type, day of week.
Calculate expectancy for each filter.
Cut any filter with negative expectancy and a sample size over 30.
Flag any filter with negative expectancy and a sample size under 30 for more testing.
Increase allocation to filters with the highest positive expectancy.
This is your performance review process. Do it every month or every quarter. The traders who do this consistently are the ones who compound. The traders who skip it keep repeating the same losing patterns for years.
Walkthrough: The Quarterly Cut
Your last 100 trades show that Friday trades have a -0.15R expectancy (18 trades), while Monday through Thursday trades have a +0.45R expectancy (82 trades).
You eliminate Friday from your trading week. That is 18 losing-expectancy trades removed. Over the next quarter, your overall expectancy rises because you removed a drag.
Math check (Friday): Win rate on Friday: 5 wins out of 18 trades = 27.8%. Average winner: 2.1R. Average loser: 1R. (0.278 x 2.1R) + (0.722 x -1R) = 0.584R + (-0.722R) = -0.138R per trade.
0.278 times 2.1R = 0.584R. Correct. 0.722 times 1R = 0.722R. Correct. 0.584R minus 0.722R = -0.138R. Correct (rounds to -0.14R, consistent with the -0.15R stated above within rounding).
This is what it means to let data make your decisions. You did not "feel" like Fridays were bad. You checked. The numbers were clear. Now you act.
How EdgeFlo Turns Journal Data Into Actionable Reports
Filtering journal data manually works. But it is slow. You export to a spreadsheet, build formulas, sort by columns, and hope you did the math right.
EdgeFlo generates AI-powered performance reports (available on Plus) from your journal data. These reports identify recurring patterns, flag underperforming setups, and surface the specific variables that are dragging your results down.
Instead of spending an hour on a spreadsheet, you get a weekly report that says "Your Asian session trades lost 1.2R net this week. Your demand zone entries after a liquidity sweep won 4.5R net. Consider focusing on sweep setups during London." That is data turned into action.
The reports do not make decisions for you. They surface the patterns. You decide what to cut, what to keep, and what to test next. But the surfacing step, the part most traders skip because it is tedious, happens automatically.
Your equity curve is the final judge. If the curve is trending up, your data-driven decisions are working. If it is flat or declining, pull another report and find the leak.
How do I use journal data to improve my trading?
What metrics should I track in my trading journal?
How many trades do I need before journal data is useful?
Can feelings ever be useful in trading?

Turn discipline on.
Every session.
EdgeFlo is the environment serious traders operate inside.
Start 7-Day Trial — $7
Cancel anytime.
No long-term commitment.


Think Different, Trade Different.