

Choppy Market: How to Spot It and Step Away
Choppy markets eat stop losses for breakfast. Learn three signs that price is consolidating, not trending, and why stepping away beats forcing trades in the chop.

You take a short. Price drops 20 pips then reverses and stops you out. You flip long. Price goes up 15 pips then reverses again. You flip short once more, convinced the breakout is real this time. Stopped out. Three trades, three losses, and the pair has moved less than 40 pips total.
You were not wrong about direction. You were trading in chop.
Choppy markets are the single most expensive environment for trend-following traders because every signal looks real until it reverses. Recognizing chop early and stepping away is a skill that saves more money than any entry technique.
TL;DR
Choppy markets are consolidation phases where price oscillates in a range without establishing a trend.
Three signs: overlapping candle bodies, equal highs and lows forming, and market structure that flips between bullish and bearish on every swing.
Most trend-following setups fail in chop because there is no follow-through.
The most profitable response is usually to stop trading and wait for a breakout with structure confirmation.
Forced trades in chop are a primary cause of overtrading and account drawdowns.
Why Choppy Markets Destroy Traders
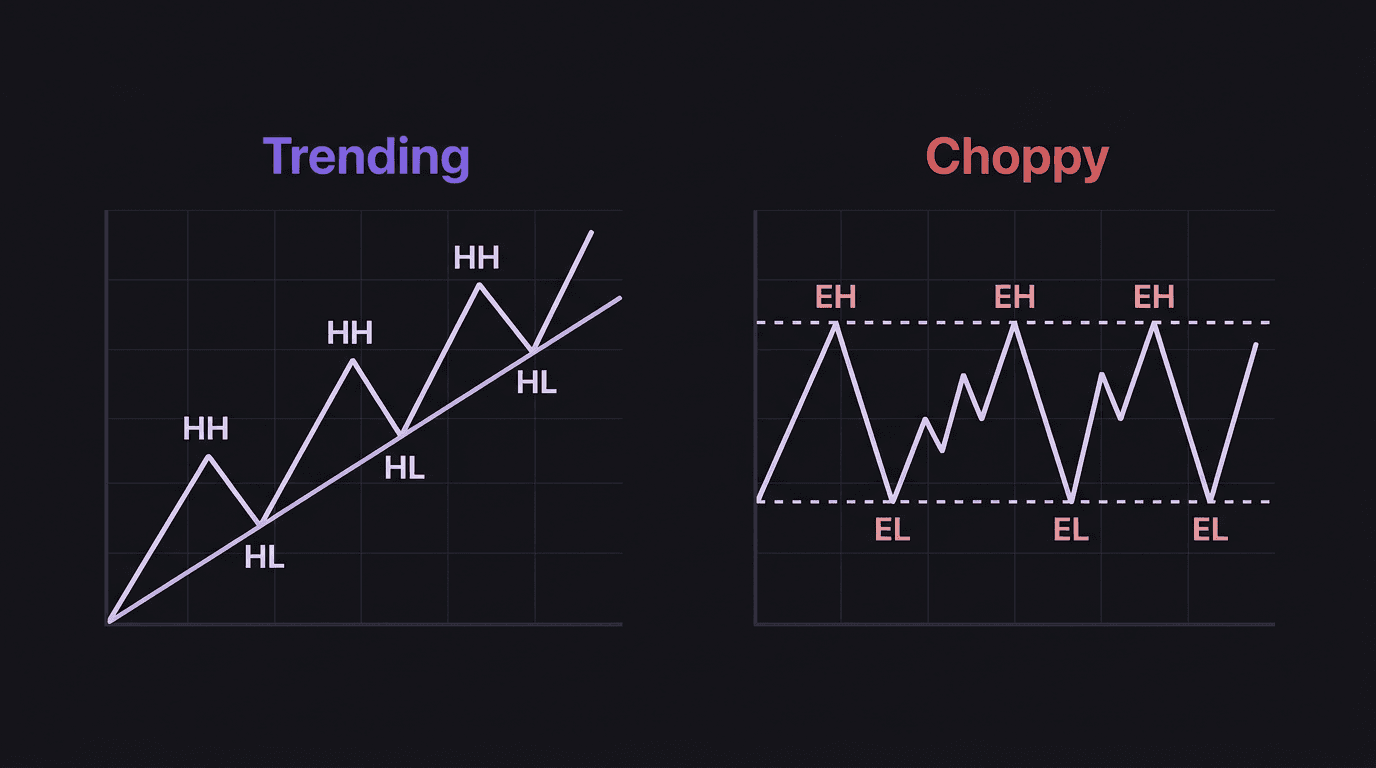
Trending markets reward patience and direction. You identify the bias, find a pullback, enter with confluence, and let price run. The structure is clean. Higher highs and higher lows (or the inverse for bearish) give you a roadmap.
Choppy markets have no roadmap. Price moves up, creates what looks like a bullish break of structure, then immediately reverses. It moves down, creates what looks like a bearish shift, then reverses again. The candles are full of long wicks and small bodies. Every move feels like the start of something that never follows through.
Your entry criteria get triggered repeatedly because the individual candles look like valid signals. But the signals are traps. There is no momentum behind any of them. Supply and demand are roughly equal, so price ping-pongs between the same levels.
The damage comes from the accumulation of small losses. Each individual loss is within your risk limit, but you take five or six in a row because each new setup looks valid at the moment of entry. By the time you recognize the chop, you are down 3% to 5% for the day.
Three Signs You Are in Chop
Sign 1: Overlapping Candle Bodies
In a trend, candle bodies stack. Bullish trends show green body after green body with minimal overlap. Bearish trends show red bodies cascading lower.
In chop, bodies overlap heavily. A green candle's body sits inside the previous red candle's range. The next red candle closes inside the green one. There is no separation. If you zoom out and the candles look like a tangled mess rather than a staircase, you are in chop.
Sign 2: Equal Highs and Equal Lows
Trending price makes higher highs and higher lows (bullish) or lower highs and lower lows (bearish). Choppy price makes equal highs and equal lows, or worse, a mix of both.
You see price tap a high at 1.0940, pull back to 1.0910, push back up to 1.0942, pull back to 1.0908. Those are roughly equal highs and equal lows. The range is defined. Price is not going anywhere.
Sometimes the range is wider, with highs at one level and lows 60 or 80 pips away. But if structure is not progressing in one direction, it is consolidation regardless of the range width.
Sign 3: Market Structure Flips Rapidly
This is the most actionable sign. On your execution timeframe (say the 15-minute), you see a bullish break of structure. Two candles later, a bearish break of structure. Then bullish again.
In a trending market, structure breaks in one direction and holds. In chop, structure breaks are immediately undone. If you see two or more structure flips within a handful of candles, the market is not trending. It is rotating.
Stop trying to pick a direction. There is no direction yet.
Walkthrough: Getting Caught in EUR/USD Chop
It is the New York session. EUR/USD has been ranging between 1.0905 and 1.0945 since London. You see price mitigate a supply zone at 1.0940 and get a bearish reaction with a market shift on the 5-minute chart. You enter short at 1.0935 with a stop at 1.0950 (15 pips) and a take profit at 1.0890 (45 pips, 3R target).
Price drops to 1.0915 (20 pips in your favor). You feel good. Then it reverses, pushes back to 1.0938, pulls back to 1.0918, and then grinds up to 1.0950. Stopped out for a 15-pip loss.
You see another bearish signal and enter again at 1.0942, stop at 1.0955 (13 pips). Price drops to 1.0920, reverses, and stops you out at 1.0955. Two losses, 28 pips gone.
Looking at the 1-hour chart, the candles have been overlapping inside a 40-pip range for 6 hours. The 15-minute structure has flipped three times. This is textbook chop.
The mistake was not the analysis on individual trades. Both entries had valid confluence. The mistake was trading in an environment where valid signals do not produce follow-through.
What to Do When You Spot Chop
The answer is boring and it is the hardest thing in trading: do nothing.
Close the chart. Walk away. Check back in an hour. Or two. Or wait for the next session.
Chop ends when it ends, usually with a news catalyst, a session change, or an accumulation of orders at the range boundary that finally breaks through. You cannot force the breakout by taking more trades inside the range.
If you have a hard time stepping away, set a rule. For example: "If I take two consecutive stop-outs within an hour and the 1-hour chart shows overlapping bodies, I close the platform for 90 minutes." Make it specific. Write it in your plan. Follow it the same way you follow your entry criteria.
The traders who profit from choppy markets are the ones who are not in them. They preserved their capital during the chop and deployed it when the trend resumed. Trading patience is not passive. It is a position.
Knowing When Chop Is About to Break
Chop does not last forever. Eventually, one side overwhelms the other and price breaks out. A few signs suggest the breakout is approaching:
Tightening range. If the highs are getting lower and the lows are getting higher (a squeeze), volume and volatility are compressing. The breakout is usually imminent.
Liquidity build at both ends. When equal highs and equal lows stack up at the range boundaries, that liquidity becomes a target. Smart money will sweep one side to fuel a move in the opposite direction. Wait for the sweep, then wait for structure confirmation in the direction of the breakout.
Session change. London open often breaks Asian chop. New York open often breaks a stale London range. If you know when to stop trading during dead zones and when to re-engage at session opens, you naturally avoid the worst chop windows.
The breakout from a range often produces the cleanest entries of the week, because the extended consolidation has loaded up liquidity on both sides. Patience through the chop positions you for the best trade, not the fifth-best.
How EdgeFlo Helps You Avoid Chop Losses
EdgeFlo's guardrails restrict trading when your daily loss limit approaches, which catches you before chop-induced losses snowball (you can override, but you have to consciously choose to continue). If two stop-outs in a row would put you near your daily cap, the restriction fires and forces a pause.
The pre-market checklist prompts you to assess current market conditions before you place any trade. If you note "ranging" or "no clear structure" during pre-market, that flag reminds you to wait for a breakout rather than forcing entries into the range.
Your dashboard tracks trade frequency by session and day. If a particular day of the week or session window consistently shows higher loss rates, that data tells you exactly when the chop tends to happen in your trading history, so you can plan around it.
What does a choppy market look like?
Can you trade profitably in a choppy market?
How long do choppy markets usually last?
Should I switch to a lower timeframe in choppy conditions?

Turn discipline on.
Every session.
EdgeFlo is the environment serious traders operate inside.
Start 7-Day Trial — $7
Cancel anytime.
No long-term commitment.


Think Different, Trade Different.