

Capital Preservation: Why Survival Beats Fast Growth
Professional traders protect capital first and grow second. Learn the survival-first mindset that separates long-term winners from fast flameouts.

There are two types of traders who blow a $10,000 account. The first type never learned risk management. The second type learned it, understood it, and then ignored it because growing the account faster felt more important.
Both end up in the same place: watching a balance hit zero and wondering what happened.
Capital preservation is the decision to protect what you have before chasing what you want. It is the boring, unglamorous choice that separates traders who last three years from traders who last three months. And it is the single most important skill that nobody wants to talk about because "protect your capital" does not get clicks like "I turned $500 into $50,000."
TL;DR
Capital preservation means keeping your account alive through losing streaks, not avoiding losses entirely.
At 0.5% risk per trade, it takes 200 consecutive losses to blow your account. That is effectively impossible.
Losing 50% of your account requires a 100% gain just to break even. The math punishes aggressive risk exponentially.
Professional traders and institutions never risk more than 1% per trade. Most use less.
Slow growth on a protected capital base compounds faster over 12 months than aggressive growth that resets to zero.
The Recovery Math That Changes Everything
Here is the number that should permanently rewire how you think about risk.
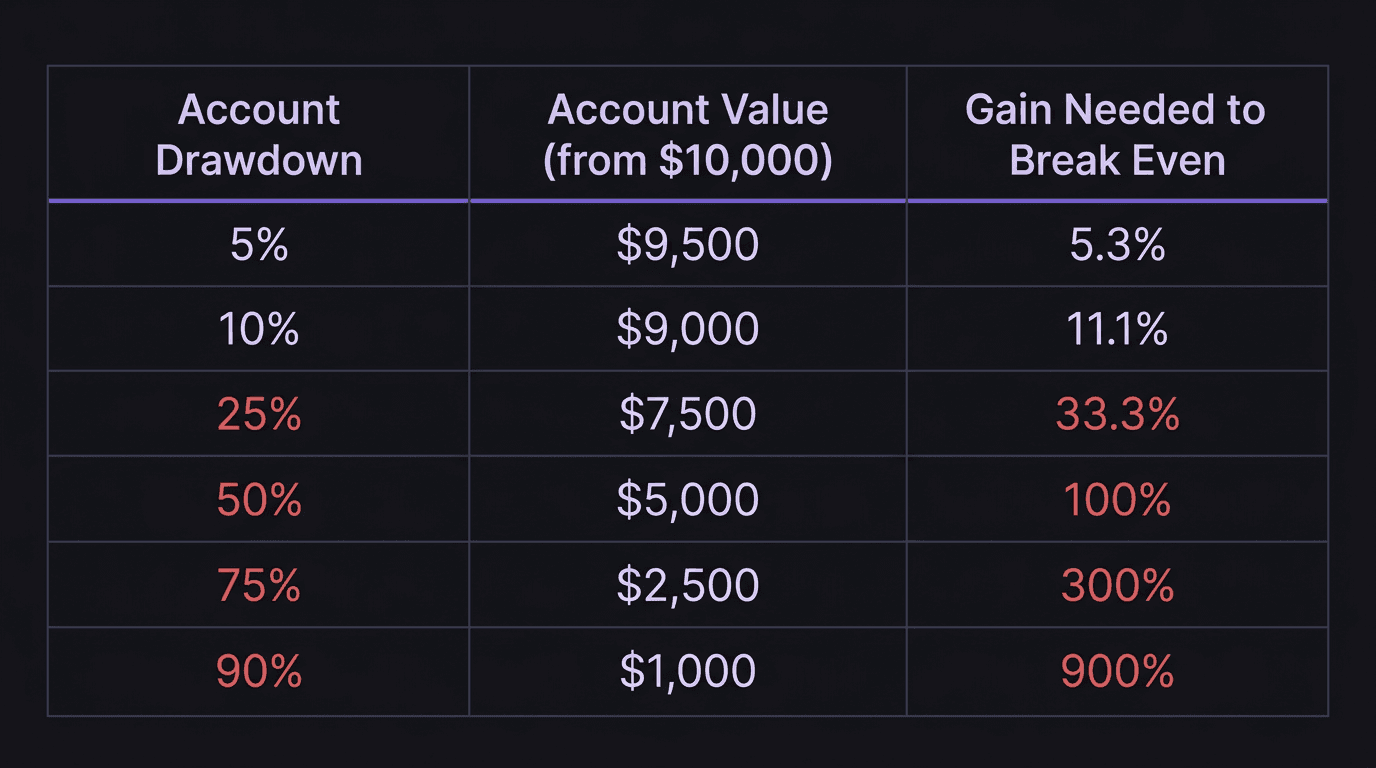
If you lose 10% of your account, you need an 11.1% gain to break even. Not bad. Recoverable in a good week.
If you lose 25%, you need a 33.3% gain. That is a full month of strong trading.
If you lose 50%, you need a 100% gain. You need to double your remaining balance just to get back to where you started.
And if you lose 75%? You need a 300% gain. At that point, most traders reload the account or quit entirely.
The relationship between losses and recovery is not linear. It is exponential. The deeper the hole, the steeper the climb out. This is why position sizing at 0.5% per trade is not conservative. It is strategic. It keeps your drawdowns in the "easy to recover" range and out of the "mathematically improbable to recover" range.
The Bullet Analogy: Risk Per Trade Is Your Ammo
Think of every trade as a bullet. Your account balance is your ammunition supply. Every loss uses up a bullet. When you run out of bullets, the game is over. It does not matter how skilled you are if you have no ammunition left to fire.
At 1% risk per trade, you have 100 bullets. You can lose 100 trades in a row before the account hits zero. That is a lot of room to absorb losing streaks, recover, and find your rhythm.
At 0.5% risk per trade, you have 200 bullets. You would need to lose 200 consecutive trades to blow the account. Even a monkey randomly pressing buy and sell would win some of those trades by pure chance. At 0.5% risk, total ruin is virtually impossible for any trader with a real strategy.
At 5% risk per trade, you have 20 bullets. A bad week can cost you 5 to 7 of those. At 10% risk, you have 10 bullets. Two bad days and you are halfway done.
At 50% risk per trade, you have 2 bullets. Two losses and your account is gone. That is not trading. That is gambling.
The fewer bullets you use per shot, the longer you survive. The longer you survive, the more opportunities you get to fire at high-quality setups. And the more high-quality setups you take with a positive-expectancy system, the more your account grows.
Walkthrough: The Cost of Impatience
Trader A has a $10,000 account. He is impatient. He wants to grow the account to $50,000 within three months. He risks 5% per trade ($500) with a 1:5 R:R target.
Month 1: He takes 20 trades. Wins 6 (30% win rate, which is realistic). Each win: $500 x 5 = $2,500. Each loss: $500.
Gross wins: 6 x $2,500 = $15,000. Gross losses: 14 x $500 = $7,000. Net: +$8,000.
Account balance: $18,000. He is feeling great. Ahead of schedule.
Month 2: Same approach, 20 trades. But this month, his win rate drops to 20% (4 wins, 16 losses). This happens. Variance is real.
Gross wins: 4 x $2,500 = $10,000. Gross losses: 16 x $500 = $8,000. Net: +$2,000.
Account balance: $20,000. Still okay, but the bad month shook his confidence. He increases his risk to 8% to "make up for lost time."
Month 3: 20 trades at 8% risk ($1,600 per trade on the $20,000 balance). Win rate is back to 30% (6 wins, 14 losses).
Gross wins: 6 x $8,000 = $48,000. Gross losses: 14 x $1,600 = $22,400. Net: +$25,600.
Wait. That looks incredible on paper. But that is the median outcome. Here is the problem: he hit a 5-trade losing streak in the middle of Month 3. Five consecutive losses at 8% risk = 40% drawdown. His $20,000 account dropped to $12,000 before the wins came.
During that losing streak, he panicked, abandoned his plan, took three revenge trades at 12% risk, and lost two of them. Additional damage: 2 x $1,440 = $2,880. His account hit $9,120 before he stopped.
Final balance: roughly $9,120. He started with $10,000. Three months of effort, and he is worse off than day one.
Walkthrough: The Power of Patience
Trader B has the same $10,000 account. She risks 0.5% per trade ($50) with a 1:5 R:R target. Same strategy, same 30% win rate.
Month 1: 20 trades. 6 wins, 14 losses.
Gross wins: 6 x $250 = $1,500. Gross losses: 14 x $50 = $700. Net: +$800.
Account balance: $10,800.
Month 2: 20 trades. Bad month, only 4 wins.
Gross wins: 4 x $250 = $1,000. Gross losses: 16 x $50 = $800. Net: +$200.
Account balance: $11,000.
Month 3: 20 trades. Back to 30% win rate. 6 wins, 14 losses.
Gross wins: 6 x $250 = $1,500. Gross losses: 14 x $50 = $700. Net: +$800.
Account balance: $11,800. During the worst losing streak (5 losses in a row), her drawdown was 5 x $50 = $250. That is a 2.3% drawdown from her peak. She did not panic. She did not change her risk. She stuck to the plan.
Final balance: $11,800. An 18% gain over three months. Not explosive. But the account never dipped below $10,550 at any point. Her equity curve is smooth, ascending, and fundable.
Trader A ended at $9,120. Trader B ended at $11,800. Same strategy. Same win rate. Same risk-to-reward. The only difference was risk per trade.
Why Fast Growth Is a Trap
The desire to grow an account quickly is not irrational. Time is money, and a small account earning 1% per month feels pointless. But the math does not support aggressive risk, and neither does psychology.
The math problem: Large risk per trade creates large variance. Large variance creates deep drawdowns. Deep drawdowns trigger emotional responses. Emotional responses lead to plan deviation. Plan deviation accelerates losses. This is the spiral, and it starts with the decision to "just risk a little more."
The psychology problem: After a big drawdown, most traders do not calmly de-risk and recover. They do the opposite. They increase risk to recover faster. That is how a 20% drawdown becomes a 50% drawdown becomes an empty account. The urge to recover fast is the same urge that caused the problem.
The compounding reality: Trader B at $11,800 after three months is not behind. She is ahead, because her capital base is intact and growing. After 12 months at the same pace, she is approaching $17,000 to $18,000 with no ruin risk. Trader A, if he survived, would need to navigate the same variance that nearly killed him four times per year.
The Institutional Standard: Nobody Risks More Than 1%
Hedge funds managing millions of dollars do not risk 5% or 10% per position. They typically risk 0.25% to 1% per trade. Not because they are conservative by nature, but because they understand that capital is the raw material of compounding.
Losing a client's money is career-ending. So they design systems where the worst month is a 3% drawdown, not a 30% one. Their returns (10% to 20% per year) look unimpressive on social media, but those returns on $100 million produce real wealth.
You are managing your own money with the same objective: stay in the game long enough for compounding to work. A $10,000 account growing at 10% per month (achievable at 0.5% risk with a positive-expectancy system) reaches $31,384 after 12 months. A $10,000 account that blows up in Month 4 reaches zero.
The Capital Preservation Framework
If you want to trade for a living, adopt this framework today:
Risk no more than 0.5% per trade. This is your default. Increase to 1% only after 100 trades with a proven edge and only during favorable conditions.
Set a daily loss limit at 1.5% to 2%. If you lose three trades at 0.5% each, you stop for the day. Your account cannot lose more than 2% in a single session.
Cut risk during drawdowns, not after. If your account drops 5% from its peak, reduce risk to 0.25% per trade until you recover. This is de-risking. It is the opposite of what your emotions will tell you to do, and it is exactly what professionals do.
Never adjust risk to recover faster. The desire to "size up after a losing week" is the exact behavior that turns manageable drawdowns into catastrophic ones.
Track your risk per trade in your journal. If your average risk per trade over a month exceeds your planned risk, you have a discipline leak.
How EdgeFlo Reinforces Capital Preservation
EdgeFlo's guardrails enforce your risk parameters at the point of execution. You define your maximum risk per trade, and the platform calculates lot size for you based on your stop-loss distance and account balance. You can override the guardrail (the choice is always yours), but the default behavior protects your capital.
The daily loss limit feature restricts further trading after you hit your session cap. Combined with the risk calculator, it creates two layers of protection: per-trade risk is capped, and per-session risk is capped. You cannot accidentally blow through both without making a conscious choice to override.
Capital preservation is not about being scared of losses. It is about treating your account balance as the foundation that everything else is built on. Protect the foundation, and the structure can grow as high as your edge allows. Break the foundation, and you start from nothing. Again.
The Edge Brief
Receive Insights on trading psychology, discipline, and the behavioral patterns that create consistent traders from our Founder and the EdgeFlo team, delivered to your inbox.
Think different. Trade different.
What is capital preservation in trading?
How much should I risk per trade for capital preservation?
Does capital preservation mean accepting smaller profits?
Can I still pass a prop firm challenge with a preservation approach?

Turn discipline on.
Every session.
EdgeFlo is the environment serious traders operate inside.
Start 7-Day Trial — $7
Cancel anytime.
No long-term commitment.


Think Different, Trade Different.