

Risk Management Simulation: What 100 Trades Reveals
Run a 100-trade simulation across different risk levels and see why 0.5 percent per trade with a 1:5 ratio dominates. Data-backed proof for your trading plan.

You have a trading strategy. It wins about 30% of the time and targets a 1:5 risk-to-reward ratio. Sounds reasonable. But how do you know whether that combination will actually grow your account over 100 trades, or slowly drain it?
You run a simulation. Not a backtest against historical data (that has its own value), but a randomized simulation that models what happens when you apply your risk parameters across hundreds of possible trade sequences. The results are not opinions. They are math.
And the math has a clear verdict: the risk you take per trade matters more than almost anything else in your system.
TL;DR
A 100-trade simulation reveals whether your risk parameters lead to growth, stagnation, or ruin.
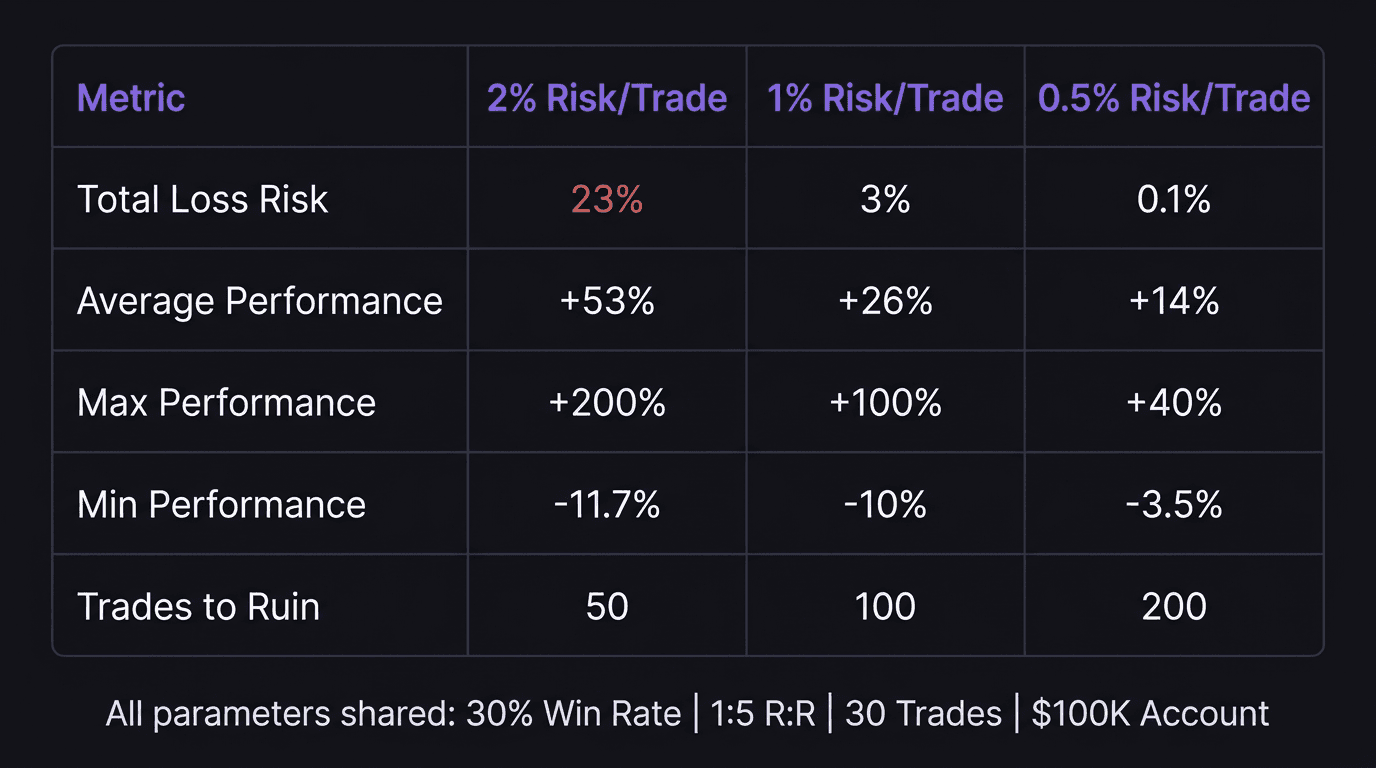
At 2% risk per trade with a 30% win rate and 1:5 R:R, the total loss risk is about 23%. Unacceptable.
At 1% risk per trade, total loss risk drops to about 3%. Better, but still not ideal.
At 0.5% risk per trade, total loss risk falls to 0.1%. This is the sweet spot for survival and growth.
The average return at 0.5% risk with a 1:5 R:R over 100 trades is approximately 50%. Slow, steady, and real.
What a Risk Management Simulation Actually Does
A simulation takes your strategy's core parameters (win rate, risk-to-reward ratio, and risk per trade) and runs them through hundreds of randomized trade sequences. Each sequence is a possible version of your next 100 trades.
Think of it like flipping a weighted coin 100 times, 100 different ways. Each flip sequence is different, but the underlying probabilities are the same. Some sequences will produce winning streaks. Others will produce brutal drawdowns. The simulation shows you the full range of what can happen.
The three numbers that matter most from any simulation are:
Total loss risk: The percentage of simulations where the account hit zero. This is your probability of ruin.
Average performance: The median outcome across all simulations. This is your most likely result.
Minimum performance: The worst-case scenario that did not end in total ruin. This is your "ugly but survivable" outcome.
Simulation 1: High Risk (2% Per Trade)
Parameters: 30% win rate, 1:5 risk-to-reward, 2% risk per trade, $100,000 account, 30 trades.
When you risk 2% per trade, you are putting $2,000 on the line each time. With a 30% win rate, you lose 70% of your trades. Each loss costs 2% and each win gains 10% (2% x 5R).
Here is what 100 simulations of 30 trades reveal:
Total loss risk: 23%. Nearly one in four simulation runs ended with the account at zero. That means if you trade this system for four 30-trade cycles, you can statistically expect one of those cycles to wipe you out.
Average performance: +53%. The middle outcome is impressive. A $100,000 account grows to about $153,000.
Maximum performance: +200%. The best run tripled the account.
Minimum performance: -11.7%. The worst non-ruin run lost about 11.7%.
The average return looks attractive. But the 23% ruin probability makes it a gamble. Would you play a game where you have a 1-in-4 chance of losing everything, even if the average outcome is good? An investor certainly would not fund that.
Simulation 2: Moderate Risk (1% Per Trade)
Parameters: 30% win rate, 1:5 risk-to-reward, 1% risk per trade, $100,000 account, 30 trades.
Cut the risk in half. Each loss costs 1%, each win gains 5% (1% x 5R). Same strategy, same win rate. Only the position sizing changed.
Total loss risk: 3%. Down from 23%. The probability of ruin dropped by a factor of nearly eight just by cutting risk per trade from 2% to 1%.
Average performance: +26%. Lower than the 2% risk scenario, but still strong.
Maximum performance: +100%. The best run doubled the account.
Minimum performance: -10%. The worst non-ruin run lost 10%.
The story changes dramatically. The average is lower, yes. But the tail risk (the chance of catastrophe) is nearly gone. You are sacrificing potential upside in the best-case scenario in exchange for near-certainty of survival.
That is not a bad trade. That is the only trade a professional makes.
Simulation 3: Low Risk (0.5% Per Trade)
Parameters: 30% win rate, 1:5 risk-to-reward, 0.5% risk per trade, $100,000 account, 30 trades.
This is the configuration that separates recreational traders from traders who last.
Total loss risk: 0.1%. Effectively zero. Out of 1,000 simulation runs, only one would expect a wipeout. You would need to lose 200 consecutive trades to blow the account, and even randomly clicking buy and sell would produce some wins in 200 attempts.
Average performance: +14%. On a $100,000 account, that is a $14,000 gain over 30 trades. If you take 3 to 5 trades per week, that is roughly one month of trading.
Maximum performance: +40%. The best run grew the account by 40%.
Minimum performance: -3.5%. The worst-case non-ruin scenario is a 3.5% drawdown. On a $100,000 account, that is $3,500. Painful, but completely recoverable.
What Changes Over 100 Trades
The 30-trade simulations show short-term behavior. Stretch the simulation to 100 trades and the differences become even more dramatic.
2% Risk, 100 Trades, 1:2 R:R (Bad Combination)
What if the risk is high and the reward target is low?
Total loss risk: 32%. One in three simulation runs ends in total ruin.
Average performance: -4%. The system is net negative on average. You lose money most of the time.
Maximum performance: +10%. Even the best run barely moved the needle.
Minimum performance: -10%. The worst run was a 10% drawdown.
This is the reality of a high-risk, low-reward system. The math does not care how confident you feel about your entries. A 30% win rate with a 1:2 R:R at 2% risk is a losing proposition. Period.
0.5% Risk, 100 Trades, 1:5 R:R (Optimal Combination)
Same 30% win rate, but now with the risk and reward calibrated correctly.
Total loss risk: 0.1%. Still effectively zero over the longer sample.
Average performance: +50%. A $100,000 account grows to $150,000 over about three months of trading.
Maximum performance: +100%. The best run doubled the account.
Minimum performance: +5%. The worst-case scenario is still a 5% gain. You made money even in the ugliest simulation run.
That last number is the one that should change how you think about risk management. At 0.5% risk with a 1:5 R:R, even the worst possible outcome over 100 trades is still a profit. The minimum floor of the system is positive.
Why the Numbers Matter for Your Trading Plan
These are not theoretical exercises. This is what happens when you apply your risk per trade rules across a statistically significant sample.
The simulation reveals three truths:
1. Risk per trade is the biggest lever. Moving from 2% to 0.5% risk per trade cut total loss risk from 23% to 0.1%. That is the single most impactful change you can make to your system.
2. The reward ratio is the second biggest lever. At the same risk level, going from 1:2 R:R to 1:5 R:R turned a losing system (negative average return) into a winning one (+50% average return). Your stop-loss and take-profit placement are not afterthoughts. They are the engine.
3. Win rate matters less than you think. A 30% win rate sounds terrible. But paired with 0.5% risk and 1:5 R:R, it produces results that most traders would envy. Chasing a high win rate by tightening stops or widening targets destroys the math. The simulation proves that trading expectancy is built on the ratio, not the rate.
How to Run Your Own Simulation
You do not need custom software. A spreadsheet works. Here is the process:
Define your parameters: win rate, R:R, and risk per trade.
Use a random number generator (spreadsheet RAND function) to determine each trade outcome: if the random number is below your win rate, it is a win; otherwise, it is a loss.
Apply the win or loss to your running balance (multiply by risk percentage and R:R for wins).
Repeat for 100 trades. That is one simulation run.
Repeat the entire sequence 100 times with new random numbers each time.
Record total loss risk, average final balance, maximum, and minimum outcomes.
If your backtesting data gives you a reliable win rate and average R:R, plug those real numbers in instead of guesswork. The simulation is only as good as the inputs.
The Lesson: Design for Survival, Not Speed
Every trader wants the 200% return from the 2% risk simulation. But that same configuration has a 23% chance of blowing the account. Would you bet your career on a 1-in-4 chance of going broke?
The 0.5% risk configuration will never produce the screenshot-worthy month. But it will still be compounding three years from now while the aggressive trader is reloading their fourth account.
That is the real edge. Not a better entry. Not a higher win rate. Survival. The simulation proves it with numbers, not opinions.
How EdgeFlo Helps You Apply Simulation Insights
EdgeFlo's risk calculator enforces your chosen risk per trade at the point of execution. You set 0.5%, and the platform calculates your lot size based on your stop-loss distance and account balance. No mental math, no rounding errors, no "just this once I will size up."
Your trading dashboard tracks the same metrics the simulation measures: drawdown depth, recovery time, and running P&L. Over time, your live results become your own simulation, and you can compare your actual performance against the expected range from your parameters.
The simulation tells you what should happen. Your dashboard tells you what actually happened. When those two diverge, you know something in your execution has drifted, and you can fix it before the damage compounds.
How many simulations do I need for reliable results?
Can a 30% win rate really be profitable?
What is total loss risk in a simulation?
Should I run simulations before going live?

Turn discipline on.
Every session.
EdgeFlo is the environment serious traders operate inside.
Start 7-Day Trial — $7
Cancel anytime.
No long-term commitment.


Think Different, Trade Different.