

Top-Down Analysis in Trading: Three Timeframes, Three Jobs
Bring structure to your chart analysis by giving each timeframe one job: direction, location, or entry. Learn how to align timeframes, identify points of interest, avoid common analysis mistakes, and wait for price to meet your plan.

Top-down analysis is a trading method that reads charts from the higher timeframe down to the lower timeframe. The higher timeframe sets trend direction, the medium timeframe finds a point of interest, and the lower timeframe confirms the entry. Combining them gives each trade a clear direction, location and trigger instead of a guess.
Open a single chart and you'll find a reason to buy and a reason to sell at the same time. Zoom in and the trend looks bearish. Zoom out and it looks bullish. Without a structured way to combine timeframes, traders end up confused, second-guessing entries, or trading against a move they never saw.
Top-down analysis solves this problem. You start on a higher timeframe and work down, and each timeframe answers one specific question.
This guide covers:
what each timeframe is for
how to choose timeframes for your trading style
what to do when timeframes disagree
the mistakes that undo good analysis
The method works the same way on forex pairs, gold (XAUUSD), stock indices, crypto and individual stocks.
What Is Top-Down Analysis in Trading?
Top-down analysis is a form of multi-timeframe analysis. A trader reads the market from the largest relevant timeframe to the smallest. Each timeframe is assigned one job:
Timeframe | Question it answers | Output |
|---|---|---|
Higher | Who is in control: buyers or sellers? | Direction |
Medium | Where is the best place to trade? | Location (point of interest) |
Lower | When should I enter? | Trigger (entry confirmation) |
The order matters. Each timeframe narrows the decision made by the one above it.
Why Top-Down Analysis Works: Price Is Fractal
Top-down analysis works because price is fractal. The same patterns appear on every timeframe. These include breaks of structure, swing highs and lows, and supply and demand zones. ( explains this in more depth.)
The relationship works in both directions. Lower-timeframe price action builds the higher-timeframe picture. For example, a single 4-hour candle contains forty-eight 5-minute candles, and each of those candles has its own structure.
Because of this, you can apply the same concepts on every timeframe. What changes is the job each timeframe does. That is the core of top-down analysis: three timeframes, three jobs.
Job 1: How the Higher Timeframe Sets Your Direction
The higher timeframe answers one question: are buyers or sellers in control of price?
1. Find the most recent break of structure. A happens when price closes beyond a previous swing point.
If price has broken above a previous swing high, buyers are in control and the trend is bullish.
If price has broken below a previous swing low, sellers are in control and the trend is bearish.
2. Mark the current swing range. The swing range is the most recent swing low and swing high that price is trading between. Marking it keeps your focus on what price is doing now, not on messy price action from weeks ago.
3. Map major supply and demand zones inside that range. Start from the most extreme zone and work inward.
Some traders also split the range into:
Premium is the upper half of the swing range.
Discount is the lower half of the swing range.
In an uptrend, the higher-probability long setups tend to sit at demand zones inside the discount area.
Job 2: How the Medium Timeframe Finds Your Location
The medium timeframe finds the right place to trade, called your point of interest. A good trade needs the right idea, at the right place, at the right time.
1. Map the internal structure. Apply the same break-of-structure logic you used on the higher timeframe. Then identify the internal high and low that price is currently trading between. ( covers this step in detail.)
Be strict about what counts as a break:
A candle body closing beyond a level is a break of structure.
A wick poking through a level is not a break of structure.
2. Refine your zones. Look for areas where strong momentum started. These include supply and demand zones, order blocks and flip zones. Institutional orders are likely to have entered at these areas before, and they may enter there again.
3. Grade the zones. Not every zone is equal. Prioritise zones that: produced a strong, clear move away from them & haven't been revisited yet (a revisited zone is called "mitigated")
sit just beyond resting liquidity, such as equal highs or equal lows that price may sweep first
The result is one or two specific areas where you would take a trade, and nowhere else.
Job 3: How the Lower Timeframe Times Your Entry
The lower timeframe has one job only. It confirms your entry once price reaches your point of interest.
On the lower timeframe, you look for your. This is the specific pattern your trading plan requires before you commit. Common examples include:
a lower-timeframe break of structure in your direction
a liquidity sweep followed by a shift in structure
a reaction from a refined zone
Order is the key discipline. You don't drop to the lower timeframe to look for trades. You drop to it only after two conditions are met:
Price has reached a location you already chose on the medium timeframe.
The trade direction makes sense from the higher timeframe.
Using the lower timeframe on its own is how traders end up chasing noise.
A Top-Down Analysis Example
Which Timeframes Should You Use for Top-Down Analysis?
The best timeframes for top-down analysis depend on how long you hold trades. The framework stays the same, but the timeframe assigned to each job shifts with your style:
Trading style | Higher (direction) | Medium (location) | Lower (entry) |
|---|---|---|---|
Scalper | 1-hour | 15-minute | 5-minute or 1-minute |
Intraday trader | Daily or 4-hour | 1-hour or 15-minute | 5-minute or 1-minute |
Swing trader | Weekly or monthly | Daily | 4-hour or 1-hour |
Choose the style that fits your personality, schedule and goals, not the one that looks most exciting. ( can help you decide.)
A swing trader making decisions at the daily close needs very different habits from a scalper working the London open. Neither is better. What matters is applying the same process consistently on the timeframes you choose.
What to Do When Timeframes Disagree: With the Trend or Against It?
When timeframes disagree, you have two valid options. You can trade the counter-trend pullback, or you can wait for the timeframes to realign. The right choice is the one written into your trading plan.
A typical conflict looks like this: the higher timeframe is bullish, but the medium timeframe has shifted bearish.
**Option 1: Trade with the higher-timeframe trend.
** The conventional advice is to always trade with the higher-timeframe trend. There is a good case for it:
With-trend trades tend to produce more expansive moves and less chop.
Many traders find with-trend trades easier to manage psychologically.
To trade with the dominant trend, wait for the medium timeframe to realign. In a bullish higher-timeframe trend, that means waiting for price to break the last lower high on the medium timeframe. That break confirms internal structure has shifted back in line, and you can then look for longs.
**Option 2: Trade the counter-trend pullback.
** Every larger trend contains counter-trend pullbacks, and those can be traded too. If the medium timeframe has shifted bearish inside a bullish swing, that pullback is a short-term move in its own right. You can trade it by selling from medium-timeframe supply zones.
There is no single winning playbook here, and both approaches can work. Decide in advance which approach you use. Otherwise, you end up choosing which trend to follow based on how you feel that day.
The Step Most Traders Skip: Waiting for Price
After the analysis is complete, the next step is to wait. If price isn't at your point of interest, there is no trade: not a buy, not a sell.
Waiting is a position in its own right, and it is often the best one available. Top-down analysis is only useful if you let price come to your area instead of forcing an entry somewhere in between. ( explores why this is so hard.)
This is where many traders undo their good work. They complete a careful top-down analysis, then get impatient and enter halfway to their zone because "it looks like it's moving."
A good setup should be obvious when it arrives. If you are flipping between timeframes trying to justify an entry, the setup isn't there yet.
Common Top-Down Analysis Mistakes
Starting on the lower timeframe. Searching the 1-minute or 5-minute chart for trades first leads to noise and conflicting signals.
Counting wicks as breaks of structure. Only a candle body close beyond a level confirms a break.
Marking too many zones. If every area is a point of interest, none of them is. Keep one or two.
Changing the plan mid-trade. Switching from with-trend to counter-trend because of one candle is emotional, not analytical.
Skipping risk management. Top-down analysis improves trade selection, but it does not remove risk. Every trade still needs a stop loss and a fixed risk per trade.
If you want to build these skills from the ground up, the free covers market structure, liquidity and trading plans in a structured path.
How EdgeFlo Helps You Stick to Your Top-Down Process
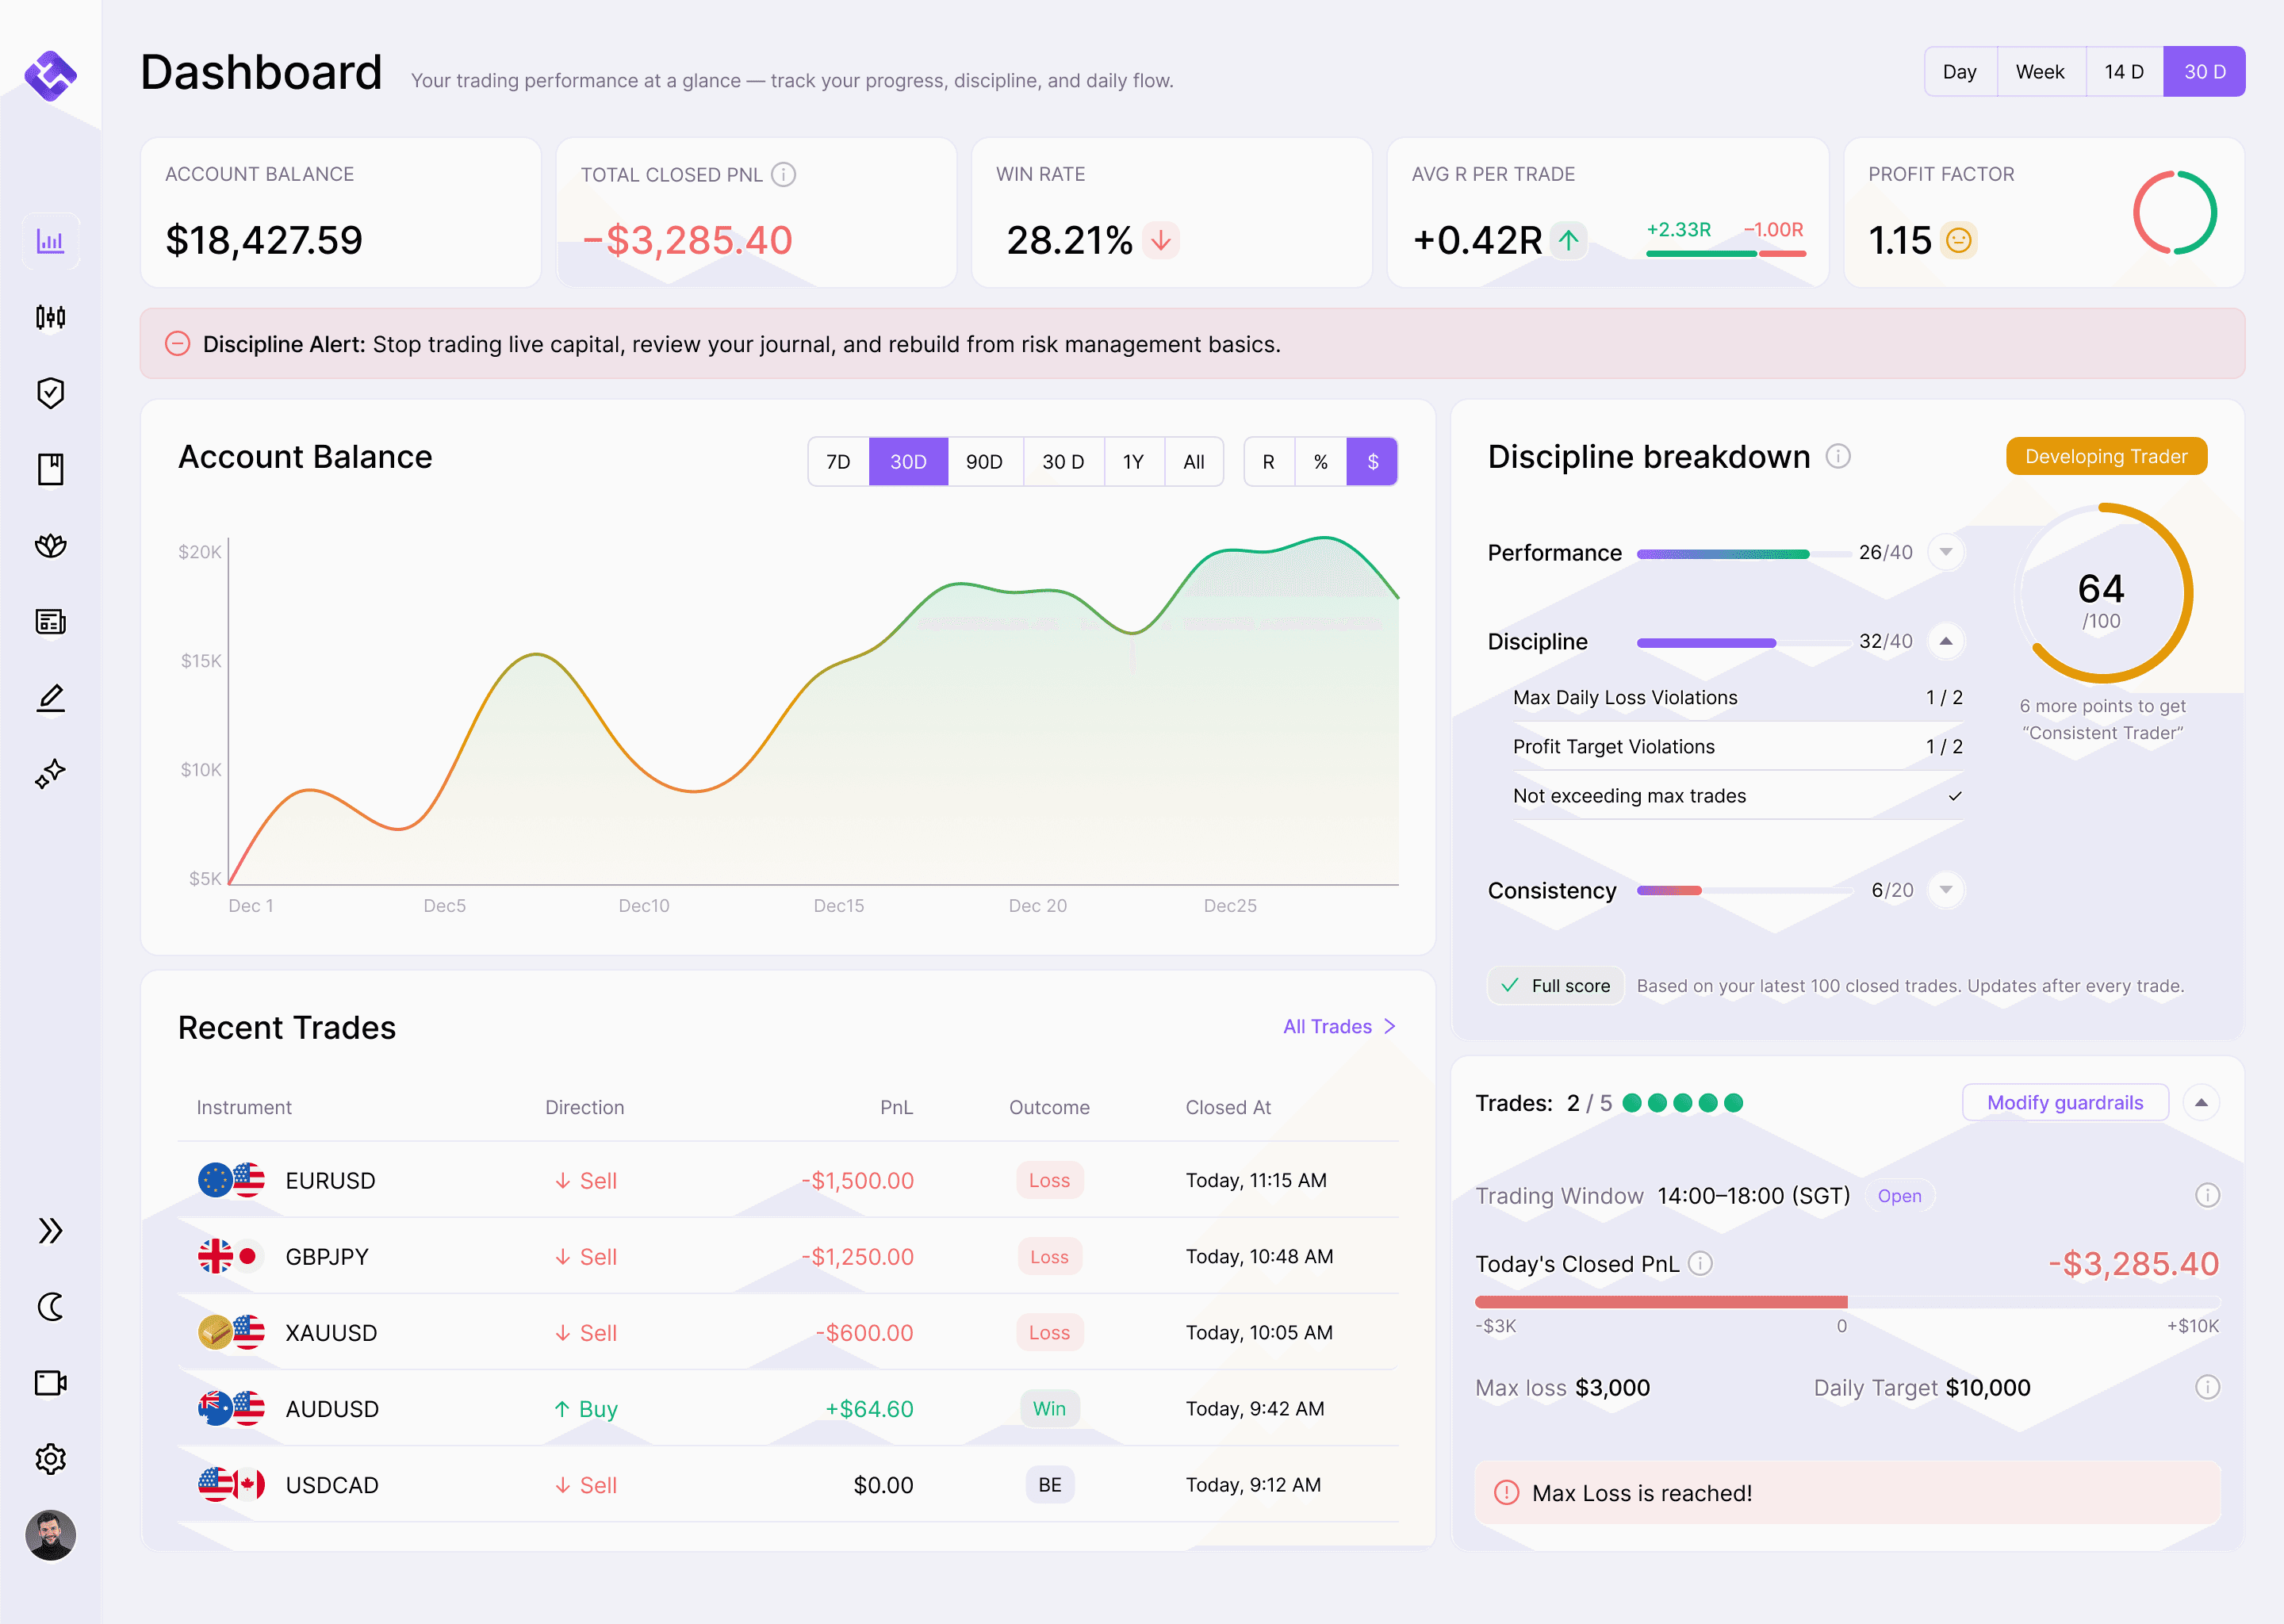
Top-down analysis only pays off if you follow it every session. EdgeFlo is a trading discipline platform built to help you execute the process you already have. It is not a broker and does not provide trade signals.
Edge Trade Plan Builder: Write your charting checklist, entry criteria and entry models into a plan, including screenshots of valid setups. Set it as active so it sits beside your chart while you trade.
Pre-Market Routine: Make your top-down analysis a required step before you trade. You can choose to block trading until the routine is complete.
Price Alerts: Set alerts at your points of interest during your routine, then step away until price arrives.
Guardrails: Max trades per day, a trading window and fixed risk per trade stop impatience from turning into forced trades.
Trade Plan Stats (Plus plan): Track win rate, net P&L and compliance for each plan. This shows which approach, with-trend or counter-trend, is working for you.
Key Takeaways
Top-down analysis reads the market from the higher timeframe down, giving each timeframe a single job.
The higher timeframe sets direction, the medium timeframe finds location, and the lower timeframe times the entry.
Only a candle body close beyond a level counts as a break of structure. A wick does not.
Match your timeframe combination to your trading style, then apply it consistently.
Decide in advance how you handle timeframe conflicts, and wait for price to reach your point of interest.
The Edge Brief
Receive Insights on trading psychology, discipline, and the behavioral patterns that create consistent traders from our Founder and the EdgeFlo team, delivered to your inbox.
Think different. Trade different.
What is top-down analysis in trading?
What are the best timeframes for top-down analysis?
What should I do when the higher and lower timeframes disagree?
Is a wick through a level a break of structure?

Turn discipline on.
Every session.
EdgeFlo is the environment serious traders operate inside.
Start 7-Day Free Trial
Cancel anytime.
No long-term commitment.

Think Different, Trade Different.