

Swing vs. Internal Market Structure: How to Read Structure Without Second-Guessing Every Candle
Learn to separate swing structure from internal structure, label strong and weak levels, and identify market shifts without second-guessing every candle.
Swing vs. Internal Market Structure: How to Read Structure Without Second-Guessing Every Candle

Quick answer: Swing structure is the main trend, defined by the most obvious break of a previous high or low. Internal structure is the smaller set of breaks that happen inside that swing range. Mark swing structure first, then internal structure. A break of the internal high or low is a market shift: an early short-term change, not a full trend reversal.
Ask ten traders to mark structure on the same chart and you'll often get ten different answers. The problem usually isn't that swing and internal market structure are complicated. It's that most traders apply the rules differently every time they open a chart. On Monday a small pullback counts as a. By Wednesday the same move is noise.
Inconsistent analysis leads to inconsistent trades. This guide gives you one repeatable process for mapping swing and internal structure, so your chart reads the same way no matter how you feel that day.
Why does market structure come first?
Market structure tells you who is in control: buyers or sellers. Every other trading decision sits on top of it.
Your, entries, stop placement and targets all depend on knowing whether price is trending, pulling back or shifting direction. Get structure wrong and everything built on it inherits the error. That's why structure is the first thing you mark, before zones, liquidity or any entry model.
In an uptrend, structure shows as. In a downtrend, it shows as lower highs and lower lows.
Step 1: How to mark swing structure
Swing structure is defined by the most obvious break of structure on your chart. A break of structure (BOS) happens when price closes beyond a previous high or low with conviction.
Start with that clear break, not the subtle one you need to squint at. That break defines your swing structure, also called external or macro structure.
In an uptrend: the highest point that led to the break is your swing high. The lowest point of the pullback is your swing low.
In a downtrend: flip it. The lowest point that led to the break is the swing low. The highest point of the pullback is the swing high.
If you're unsure which break it is, zoom out slightly.
What are strong and weak highs and lows?
A strong high or low is the level that must break to confirm the trend has changed. A weak high or low is the level price is expected to take out next.
Not every high and low carries the same weight. In a downtrend, the strong high is the swing high that led to the most recent break lower. As long as that strong high holds, sellers are in control.
In that same downtrend, the swing low is weak, because the trend is likely to push through it. Labelling both strong and weak levels on your chart makes the picture clear at a glance.
Trend | Strong level (protects the trend) | Weak level (likely target) |
|---|---|---|
Downtrend | Swing high | Swing low |
Uptrend | Swing low | Swing high |
Step 2: How to mark internal structure
Internal structure is everything between your swing high and swing low. It's made of the smaller breaks of structure that happen inside the swing range.
A practical way to see internal structure: draw horizontal lines from the minor highs and lows inside the range and extend them to the right. Each time price breaks past one of those lines, you have an internal break of structure. The most recent internal break gives you your internal high and internal low.
For a deeper definition of the two layers, see EdgeFlo's guide to.
What is a market shift in trading?
A market shift is when price breaks the internal high in a downtrend, or the internal low in an uptrend. Internal structure gives you the earliest warning of a change in direction.
A market shift doesn't mean the swing trend has reversed. It means price is shifting direction in the short term, often at the start of a pullback toward a zone.
After a market shift, the levels update. In a downtrend, the internal high moves to the new high price creates, while the internal low stays in place until price breaks it. EdgeFlo's breakdown of the covers how traders use this signal.
Why should you work one layer and one timeframe at a time?
Mixing layers and timeframes is the fastest way to get lost. Internal structure can contain its own internal structure: a second layer of breaks inside the internal range.
Analyze one layer at a time. On the 1-hour chart, you care about 1-hour swing and internal structure. When you move to the 15-minute chart, repeat the whole process on that timeframe from scratch. The same rule underpins good.
Common market structure mistakes to avoid
Starting from the wrong break. If your swing break isn't the obvious one, every level after it will be off.
Mixing timeframes. Marking 15-minute internal structure on a 1-hour chart creates clutter and confusion.
Redrawing to fit a bias. If you move levels so the chart supports the trade you want, you've stopped analyzing.
How to build the skill with reps
Market structure is a rules-based skill, so it improves with repetition. Mark swing structure, then internal structure, on 20 historical charts. Review your markups a day later. Aim for speed and consistency.
How EdgeFlo helps you apply structure consistently
Knowing the rules is one thing. Applying them the same way when you're tired, impatient or coming off a loss is another.
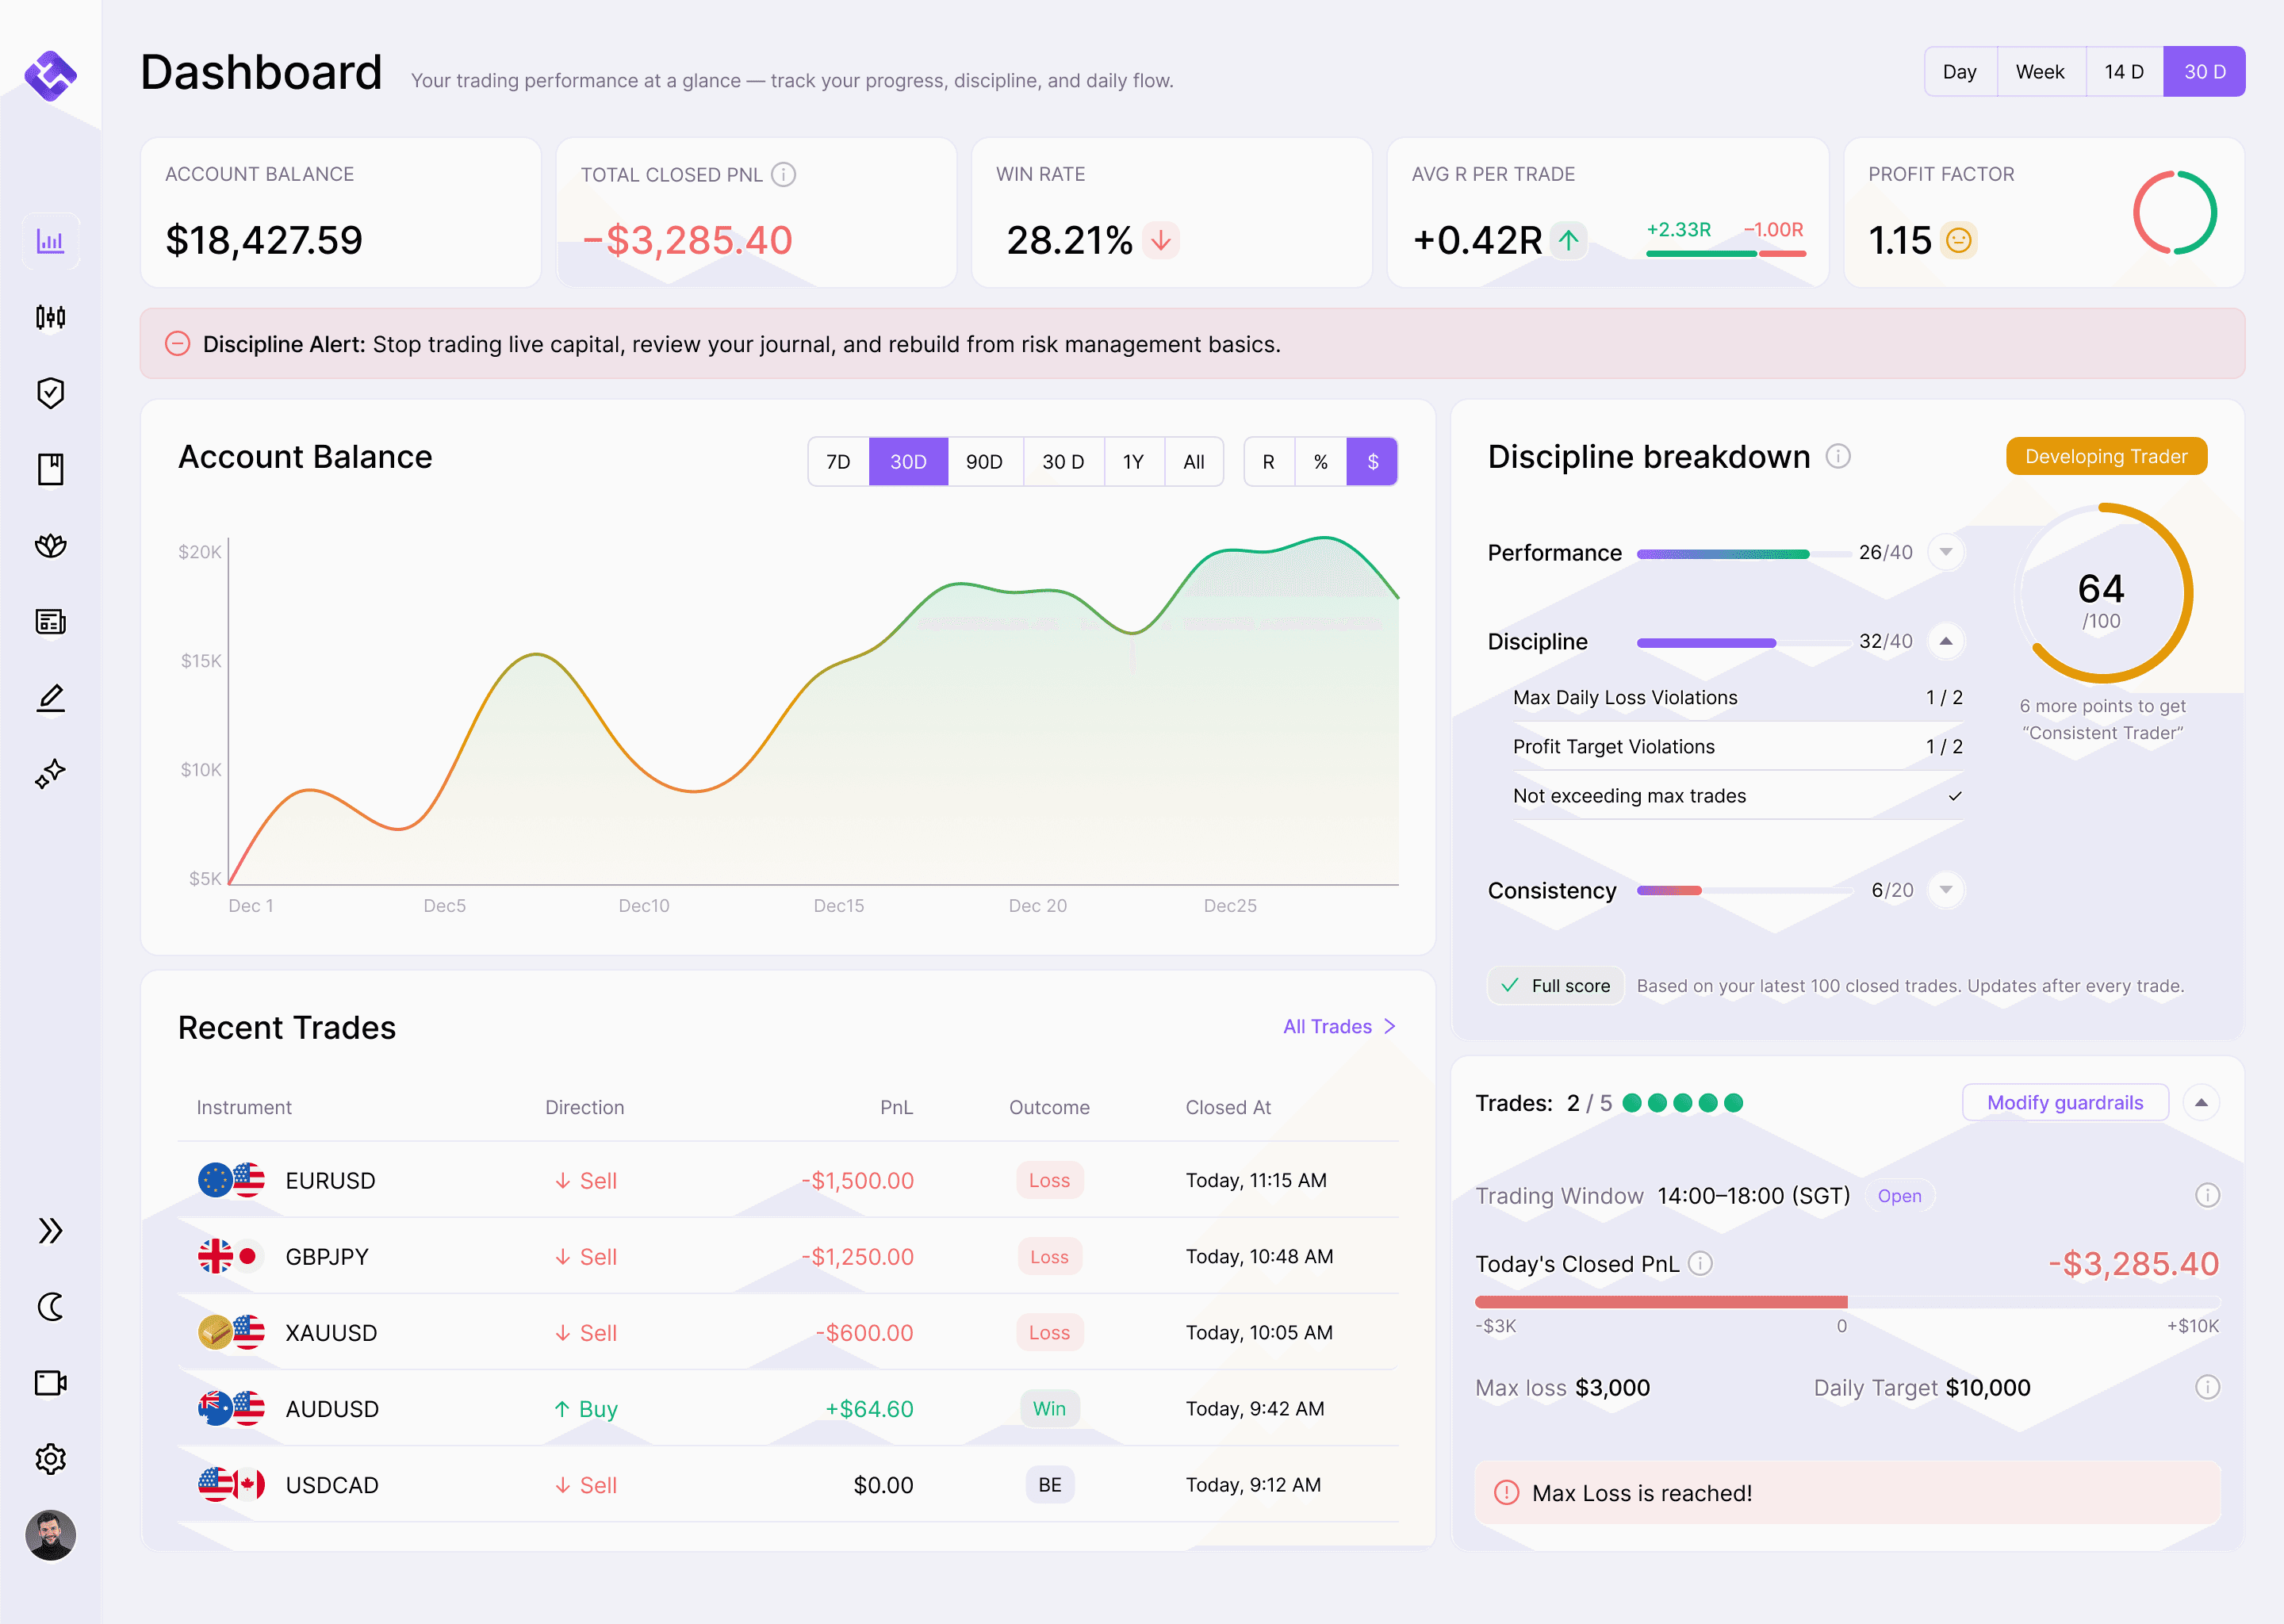
In EdgeFlo, you can write your structure-mapping steps into your Trade Plan as your charting process. The plan sits beside your chart while you trade, so the rules are in front of you at the moment you need them.
Add "swing and internal structure marked" as a step in your. You can set the routine to block trading until every step is complete, which turns analysis from a good intention into a requirement. For a deeper grounding in structure, the free in EdgeFlo Academy covers it in full.
Key takeaways
Mark swing structure first: the most obvious break defines your swing high and swing low.
Label strong levels (must break to change the trend) and weak levels (likely targets).
Everything inside the swing range is internal structure.
A break of the internal high or low is a market shift, not a full reversal.
Work one layer and one timeframe at a time.
Final thoughts
Swing and internal market structure only work when you read them the same way every time. Pick your rules, write them down and practice until marking a chart takes minutes instead of a debate with yourself. Consistent analysis is the foundation of consistent execution.
Want your charting rules beside every trade?.
The Edge Brief
Receive Insights on trading psychology, discipline, and the behavioral patterns that create consistent traders from our Founder and the EdgeFlo team, delivered to your inbox.
Think different. Trade different.
What is the difference between swing and internal structure?
What is a strong high in trading?
Is a market shift the same as a trend reversal?
How do I find internal structure on a chart?

Turn discipline on.
Every session.
EdgeFlo is the environment serious traders operate inside.
Start 7-Day Free Trial
Cancel anytime.
No long-term commitment.

Think Different, Trade Different.